
I have watched a lot of AI business cases die in CFO offices over the last two years, and almost none of them died because the technology did not work. They died because the numbers on the page did not describe what was actually happening in the business. Costs were legible. Value was not.
That gap is the whole story of AI ROI in 2026. MIT’s NANDA project ran the most cited study of the phenomenon last year, and their finding, that roughly 95 percent of enterprise generative AI pilots produce no measurable profit and loss impact, has been quoted so many times it has almost lost its meaning. It is worth reading carefully. The researchers were not saying the technology failed. They were saying the value did not show up on the income statement in a way finance could recognise.
That distinction matters. In most cases, the value was there. It was just distributed in ways traditional ROI frameworks were never built to catch.
The productivity J-curve is real, and it is uncomfortable
Every general-purpose technology has followed a similar pattern. Electricity took roughly forty years to show up in factory productivity statistics after it became widely available, because factories had to be redesigned around distributed power sources before the gains landed. The economist Erik Brynjolfsson has written extensively about how the same J-curve is playing out with AI: costs and disruption arrive first, benefits accumulate underneath the surface, and measurable output gains appear later.
The J-curve is the reason a CFO looking at year-one AI spend often sees a straight cost line with nothing beneath it. The model licences, the platform team, the change management, the eval infrastructure: those all hit the P&L on schedule. The productivity gains are real but scattered across hundreds of small workflow shifts, and they do not aggregate into a line item finance can point to.
Consider the numbers I keep seeing in enterprise data. Individual users of generative AI tools report productivity gains of five times on specific tasks. Deloitte’s 2026 State of AI report finds that 66 percent of organisations report efficiency and productivity gains, but only 20 percent report actual revenue growth from AI. Something is being lost between the individual and the enterprise.
Why traditional IT ROI models miss most of the value
For decades, IT ROI worked because IT investments had clear boundaries. A new ERP replaced an old one. A CRM automated a manual process. You could point at what got cheaper and by how much.
AI does not behave like that. It sits inside human workflows rather than replacing them, so the value shows up as small quality and speed improvements across thousands of decisions. It gets embedded across the stack, so attributing outcomes to any single deployment is often impossible. And the highest-value use cases usually reshape how work is done, not just how fast it gets done, which means the biggest gains only appear after workflows are redesigned around the tool.
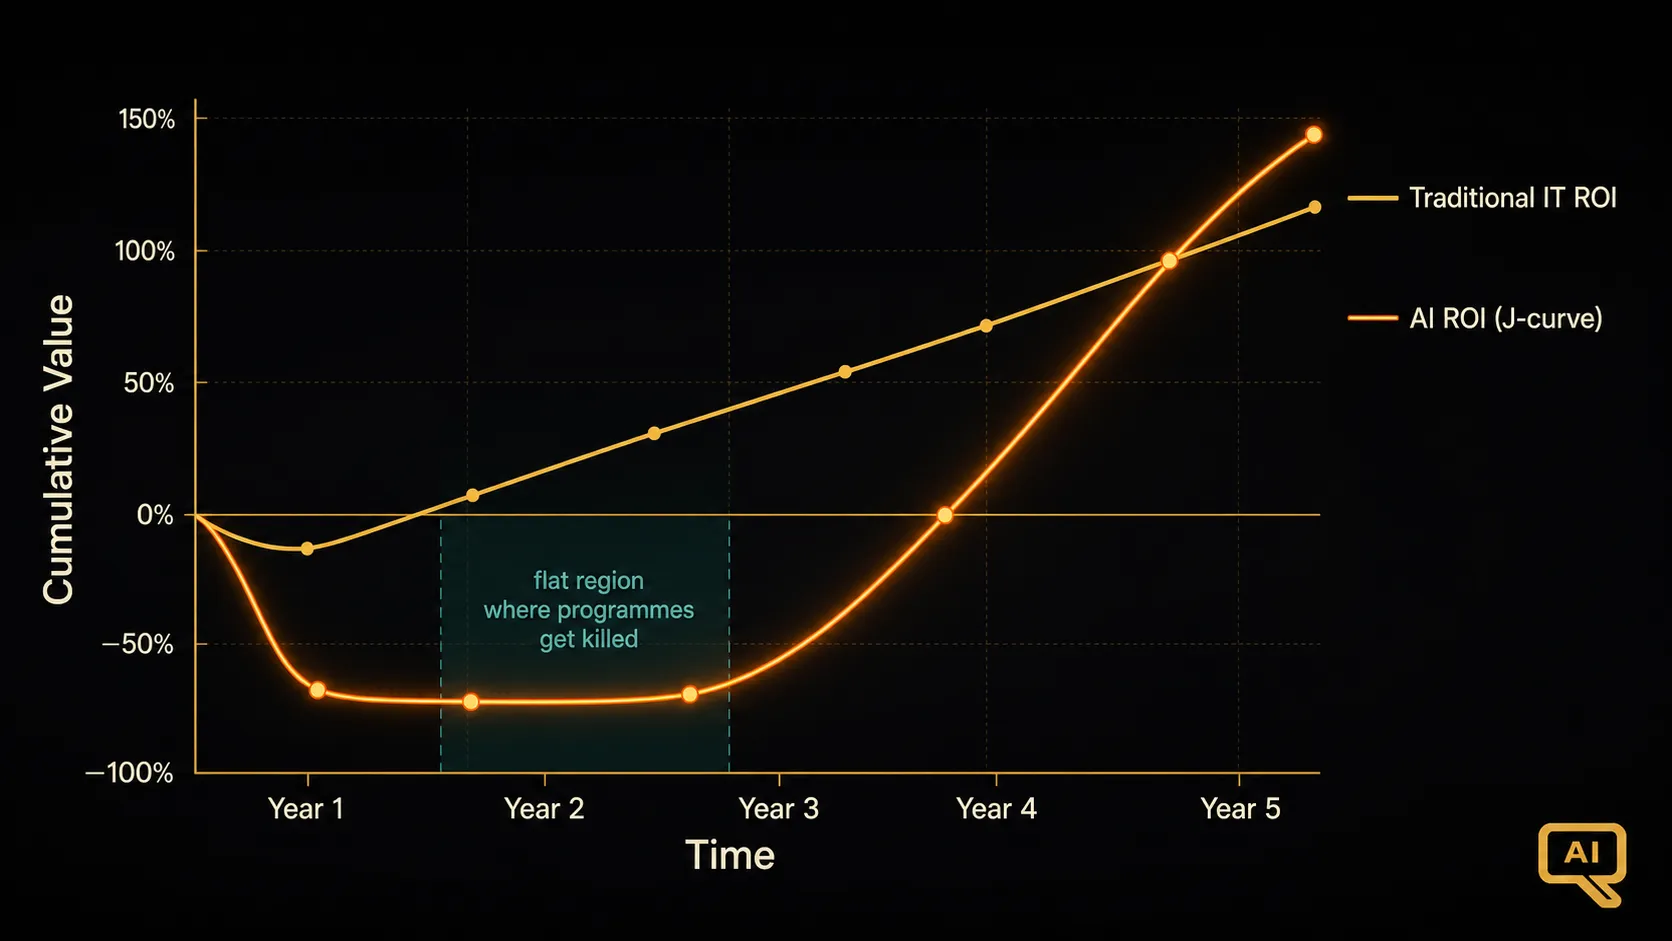
Figure 1 shows what this looks like in practice. Traditional IT investments follow a fairly predictable arc: implementation costs, then benefits landing in a defined window. AI investments trace a much steeper cost curve upfront, a longer flat period where costs continue while measurable benefits accumulate quietly, and then an inflection point that only arrives once adoption crosses a threshold and workflow redesign takes hold.
The organisations that make it through the flat period are the ones whose CFOs understood the shape of the curve going in. The ones that abandon programmes tend to do so somewhere in the middle of that flat region shown in Figure 1, when the runway looks long and the returns are still invisible.
The attribution problem is the hardest problem
Even when value is landing, proving AI caused it is genuinely hard. If your support team shipped an AI copilot in Q2 and customer satisfaction went up in Q3, was that the copilot? Or the new onboarding programme? Or the pricing change? Or the seasonal mix shift?
I have watched teams claim credit for revenue lifts that turned out to be macroeconomic tailwinds, and I have watched other teams get blamed for cost overruns that were actually a data quality problem inherited from a legacy system. Without a controlled rollout or a proper baseline, the attribution question is unanswerable.
This is why the 95 percent statistic is misleading if you read it as a failure rate. What MIT actually measured was the fraction of projects where the P&L impact was not measurable. That is a very different claim. Some fraction of those projects were producing real value that nobody set up the instrumentation to see.
Where the money is actually going
McKinsey’s 2026 State of AI survey puts numbers on the value distribution. Roughly 39 percent of organisations attribute any EBIT impact to AI so far. Only about 6 percent, the group McKinsey calls “AI high performers,” capture a disproportionate share of the value. And the split between individual productivity gains and enterprise transformation is stark: WRITER’s 2026 survey of 2,400 global leaders found that 97 percent of executives report benefiting from AI, but only 29 percent see significant organisational ROI.
Read those numbers together and a pattern emerges. Individual value is nearly universal. Enterprise value is rare. The difference is not the technology. It is whether the organisation has the systems, workflows, and measurement discipline to aggregate the individual gains into something the income statement can see.
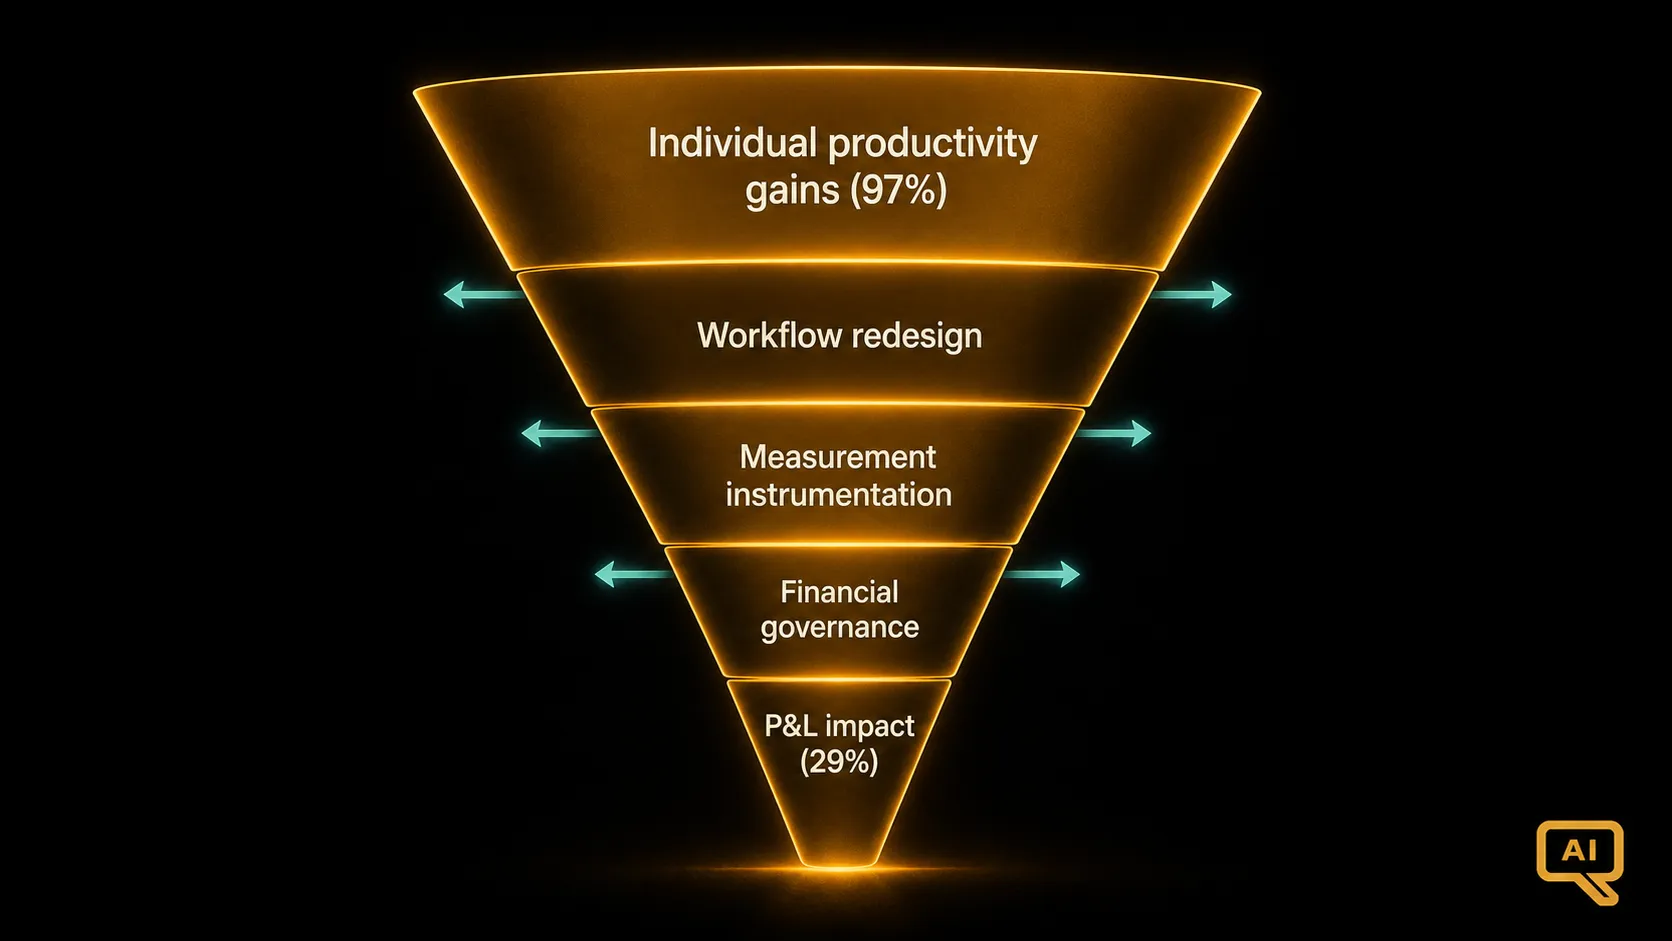
Figure 2 illustrates the aggregation funnel. Every enterprise starts with the same raw material: employees who can genuinely produce more with AI tools. Whether those gains reach the income statement depends on a series of transitions, each of which loses value if not deliberately managed. Workflows have to be redesigned so saved hours convert into throughput or capacity. Measurement has to be in place so leaders can see what changed. Financial governance has to translate operational metrics into P&L attribution.
Most organisations drop off at the first transition in Figure 2. Employees save two hours a week and then use those two hours doing other work of unclear value, which is fine for morale but invisible to finance. The high performers do something different: they redesign the work so the saved hours convert into shippable output, and they instrument the change so the conversion is measurable.
The costs are more predictable than the value
There is one more asymmetry that makes AI ROI uniquely hard. The costs are relatively predictable and land on time. Token spend, platform team headcount, licences, infrastructure: those show up in the P&L in the quarter they are incurred. The value is uncertain in timing, magnitude, and attribution.
That is a difficult shape for finance to reason about, because most capital budgeting frameworks assume symmetric uncertainty on both sides. When one side is legible and the other is fog, the fog side gets discounted heavily, sometimes to zero. This is why so many AI business cases die: not because the value is not there, but because the value cannot be defended in the language finance uses to underwrite investment.
What this means for how we build business cases
The rest of this track is built around three ideas that follow from what I have described above.
The first is that a credible AI business case has to work harder on the value side than a traditional IT case does. It needs an explicit theory of how individual gains aggregate to enterprise gains, and it needs instrumentation planned from day one so the aggregation is measurable when it happens.
The second is that the cost side is deceptively simple. Token prices are visible, but the full cost stack (which I dig into in BCR-04 and BCR-05) is much larger than the vendor invoice suggests. Under-budgeting the surround is the single most common reason business cases blow up in year two.
The third is that under deep uncertainty, the right financial framework may not be traditional NPV at all. Real options thinking, which I cover in BCR-08, is often a better fit for staged AI investments where the value of learning is a large part of the return.
None of this is a reason to give up on measuring AI ROI. It is a reason to measure it better. The organisations crossing the divide are the ones treating measurement as a first-class engineering problem, not a slide finance produces at the end. That is the shift this track is trying to help you make.