
Every AI business case needs a number at the top. That number is the value hypothesis, and how you arrive at it determines whether the rest of the case has any credibility at all. Get the sizing wrong and everything downstream is wrong: your NPV, your payback, your resourcing, your board narrative. Get it right and you have something you can defend, refine, and learn from.
I want to talk in this article about how the sizing actually gets done, because I have watched too many teams reach for vendor benchmarks or top-down market estimates and end up with numbers that fall apart the moment anyone asks a follow-up question.
The three lenses of value
Before any sizing method works, you need to know which kind of value you are actually claiming. AI creates value through three distinct channels, and each one has different sizing dynamics, different evidence standards, and different odds of showing up in the P&L on the timeline you promise.
Cost reduction is the easiest to size and the hardest to actually realise. Easy because you can point to specific activities, measure current cost, and estimate the reduction. Hard because “hours saved” rarely converts to cash unless you actually reduce headcount, reduce contractor spend, or redeploy people to higher-value work. Deloitte’s 2026 research found that 66 percent of organisations report productivity gains from AI, but only a small fraction can point to those gains showing up as reduced operating expense.
Revenue growth is much harder to size but tends to be more valuable when it lands. Deloitte’s same survey found that 74 percent of organisations aspire to grow revenue through AI, but only 20 percent are actually doing so. The gap is telling. Revenue attribution requires you to prove causation in a system where many things move at once, and most companies have not set up the measurement infrastructure to do that.
Risk reduction is the most underrated of the three. Preventing a bad outcome (a compliance breach, a customer defection, a bad hiring decision, a security incident) can be worth more than any productivity gain, but it is almost never in the base business case because the counterfactual is invisible. The organisations that build risk reduction into their value hypotheses tend to be in regulated industries where they have to.
Most strong business cases include at least two of the three lenses. Cases that lean entirely on one usually understate the total value, and cases that mix all three without discipline usually double-count.
Top-down sizing: fast, cheap, and dangerous
The top-down approach starts with a benchmark and works downward. Take the market or function-level estimate (McKinsey’s $2.9 trillion projection for AI agents by 2030, or Accenture’s $7,800 per knowledge worker per year, or the IBM figure of $3.50 return per $1 invested) and apply it to your organisation’s size.
Top-down is useful for two things: getting a first-pass estimate quickly, and stress-testing whether your bottom-up number is roughly in the right ballpark. It is dangerous for everything else. The benchmarks come from vendor research with obvious selection bias, from aggregate industry studies that hide enormous variance, or from case studies of the small minority of high performers.
If you use top-down sizing at all, discount aggressively. The typical enterprise is not the top-quartile case study. Assume you are median at best until you have evidence otherwise. And always disclose the source and the assumption chain so the reader can evaluate the credibility.
Bottom-up sizing: slower, harder, and much more defensible
Bottom-up sizing starts with the unit of work the intervention affects and multiplies from there. It has the shape: value per unit, times units per period, times fraction addressable by the intervention, times expected impact, times adoption rate.
Take a support copilot as an example. The unit is a support ticket. If you handle 400,000 tickets a year, and the average handle time is 12 minutes, and the fully-loaded cost per agent-minute is $0.80, your current handle-time cost base is $3.84 million a year. If the copilot addresses roughly 60 percent of ticket types, and reduces handle time on those by 20 percent, and you achieve 70 percent adoption within the target teams, the annual gross value is $3.84 million times 0.6 times 0.2 times 0.7, or roughly $322,000.
That is a much smaller number than you would get from a top-down calculation, and it is much more defensible. Every input is auditable. Every input is testable. Every input can be revised as evidence comes in.
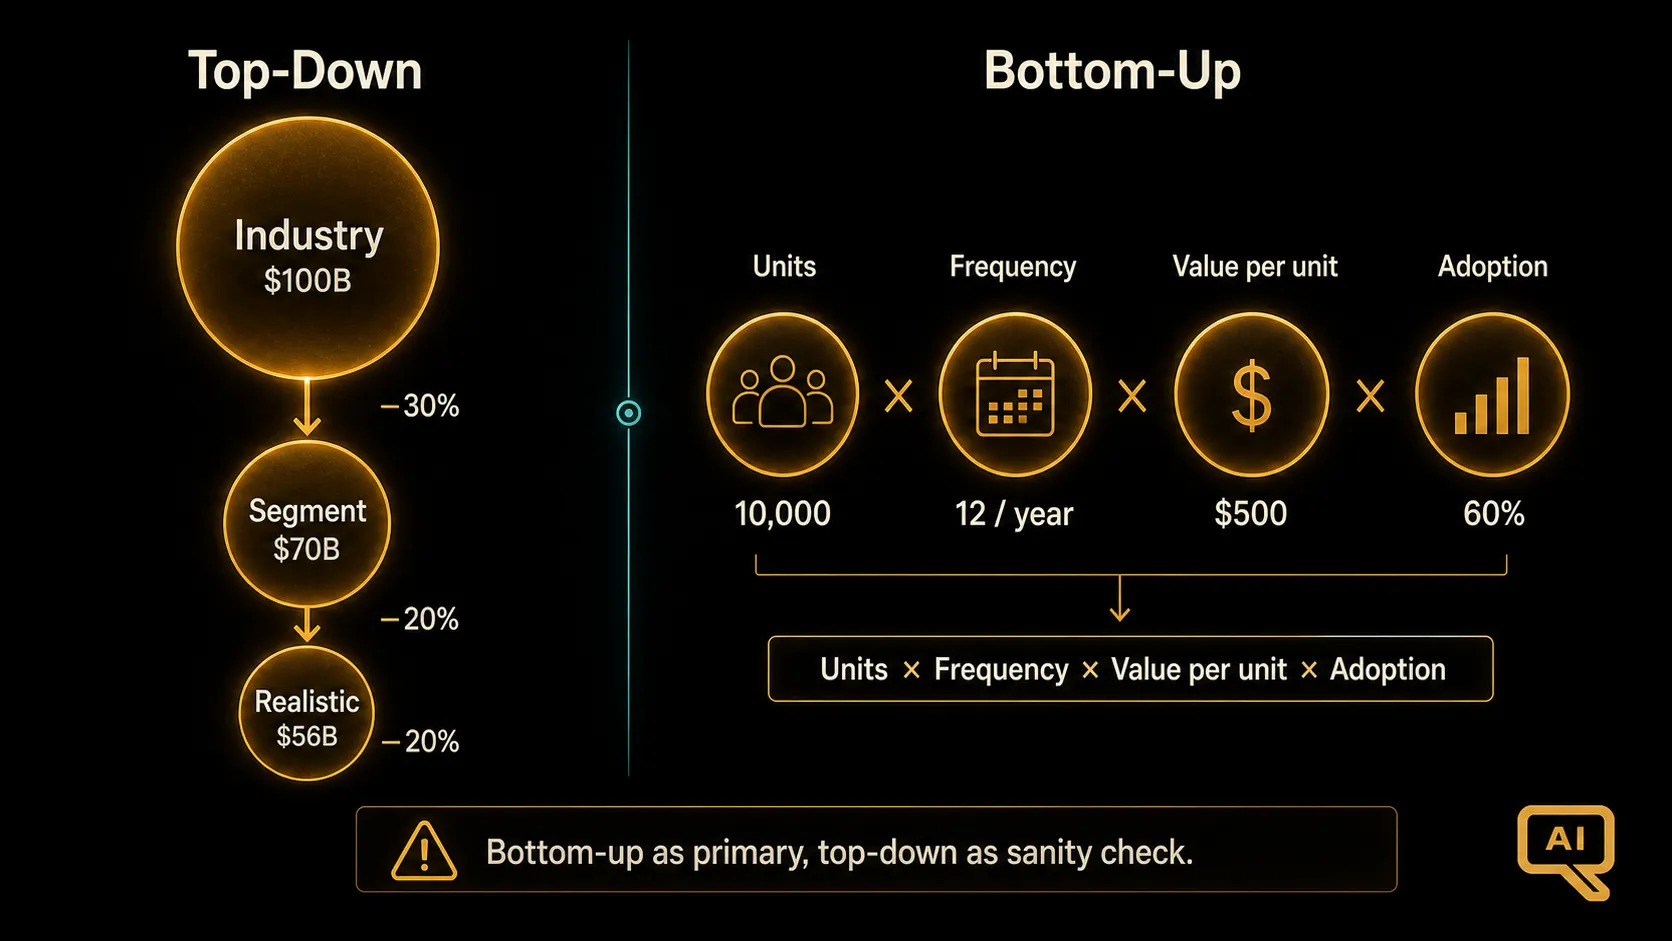
Figure 1 shows both approaches side by side. Looking at Figure 1, I recommend running bottom-up as your primary method and top-down as a sanity check. If the two methods disagree by an order of magnitude, one of them is wrong, and it is worth understanding why before you commit to either number.
The adoption multiplier is where most cases die
Notice that the bottom-up calculation above included an adoption rate of 70 percent. That single input dominated the outcome. Change it to 30 percent and the value drops from $322,000 to $138,000. Change it to 90 percent and it rises to $414,000.
Adoption is almost always the highest-leverage input in a value hypothesis, and it is almost always the one people are least honest about. Most business cases quietly assume 80 to 100 percent adoption because anything lower makes the numbers look bad. Reality is that median adoption of new enterprise tools in the first year is often in the 30 to 50 percent range, and AI tools are not automatic exceptions.
Two things help here. First, base your adoption assumption on the specific rollout plan, not on the general availability of the tool. Adoption grows with training, incentives, workflow integration, and manager accountability. If your plan does not include those, assume lower adoption. Second, decompose adoption into stages: awareness, trial, regular use, and dependency. Each stage has its own conversion rate, and modelling them separately gives you a much better estimate than a single blended number.
Building the credible range
A single-point estimate is a red flag to any experienced reviewer. The right output of a value hypothesis is a range, ideally with three scenarios: worst case, base case, and best case, each with the assumptions that drive them.
The worst case should be genuinely bad, not just slightly below the base case. It should reflect the scenarios where adoption stalls at 25 percent, where model performance is at the low end of the expected range, where the addressable fraction of the workflow turns out to be smaller than estimated. If your worst case still shows a positive return, either you are being dishonest with yourself or the intervention is genuinely low-risk. Both are worth knowing.
The best case should reflect the scenarios where things go right: strong adoption, workflow redesign amplifies the gains, adjacent use cases open up. It sets the upper bound of what success looks like, and it is useful for setting stretch targets and for identifying what would need to be true for the best case to become plausible.
The base case is what you commit to. It should be honest about what you actually expect, given a realistic view of your organisation’s execution capability. Most business cases have base cases that are secretly best cases; the discipline of forcing yourself to describe a genuine worst case tends to pull the base case down towards reality.
The vendor benchmark trap
I want to spend a moment on vendor benchmarks specifically. You will see numbers like “customers see 333 percent ROI with a 6-month payback” or “3.5x return per dollar invested” or “40 percent productivity gains.” These numbers are not made up, but they are drawn from customer references, which are the highest-performing users of the tool, selected to be case studies.
Using vendor benchmarks as your value hypothesis is roughly equivalent to sizing your marathon time based on Olympic finalists. The distribution matters, and the vendors are showing you the tail. If you must use vendor benchmarks, apply a heavy discount (I use 50 to 70 percent as a starting point) and treat them as an upper bound, not a base case.
Instrumenting for validation
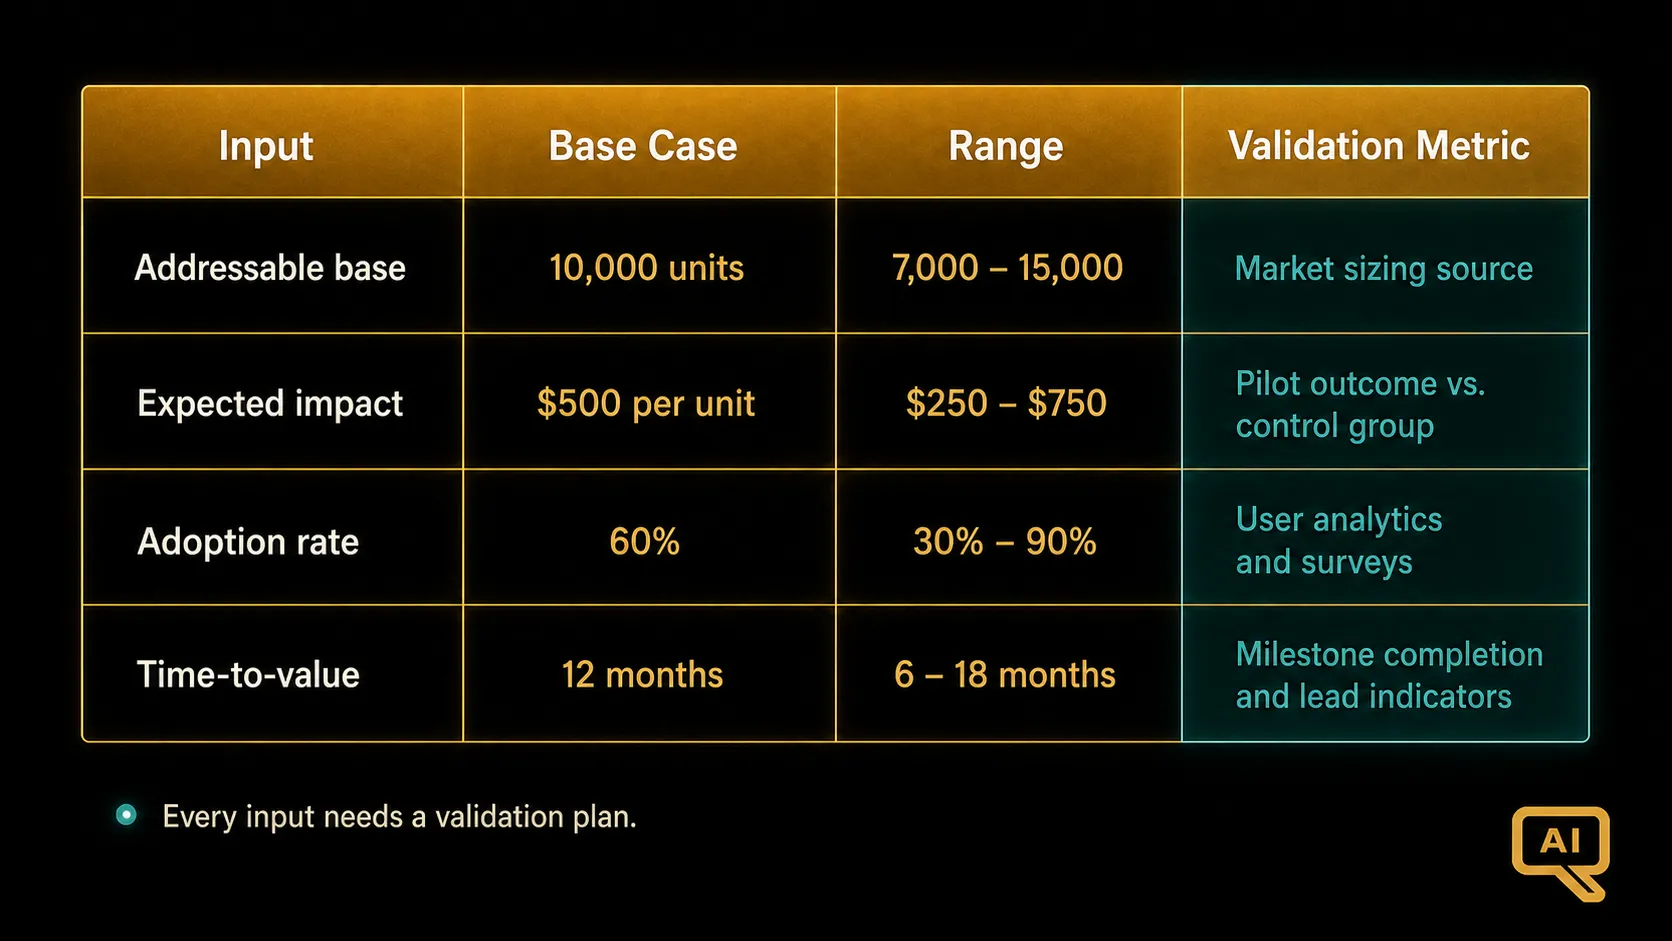
Figure 2 shows the template I use for value hypothesis worksheets. The critical column is on the right: for each input, what is the specific evidence you will collect to validate it, and on what timeline? Without that column, the value hypothesis is just a projection. With it, the hypothesis becomes something the organisation can learn from as evidence comes in.
The most valuable thing about a well-sized value hypothesis is not the number at the top. It is that you know exactly where the number is fragile, which is what the validation column in Figure 2 forces you to be explicit about, which means you know what to measure first, and you can update the case in near-real time as production evidence starts landing.
That last point is where most business cases fall short and where the best ones separate themselves. Sizing the prize is not a one-time exercise done to get funding. It is the first draft of a live model that gets refined as reality intrudes. If your sizing method does not produce something you can update quarterly with new evidence, it is probably not sized right in the first place.