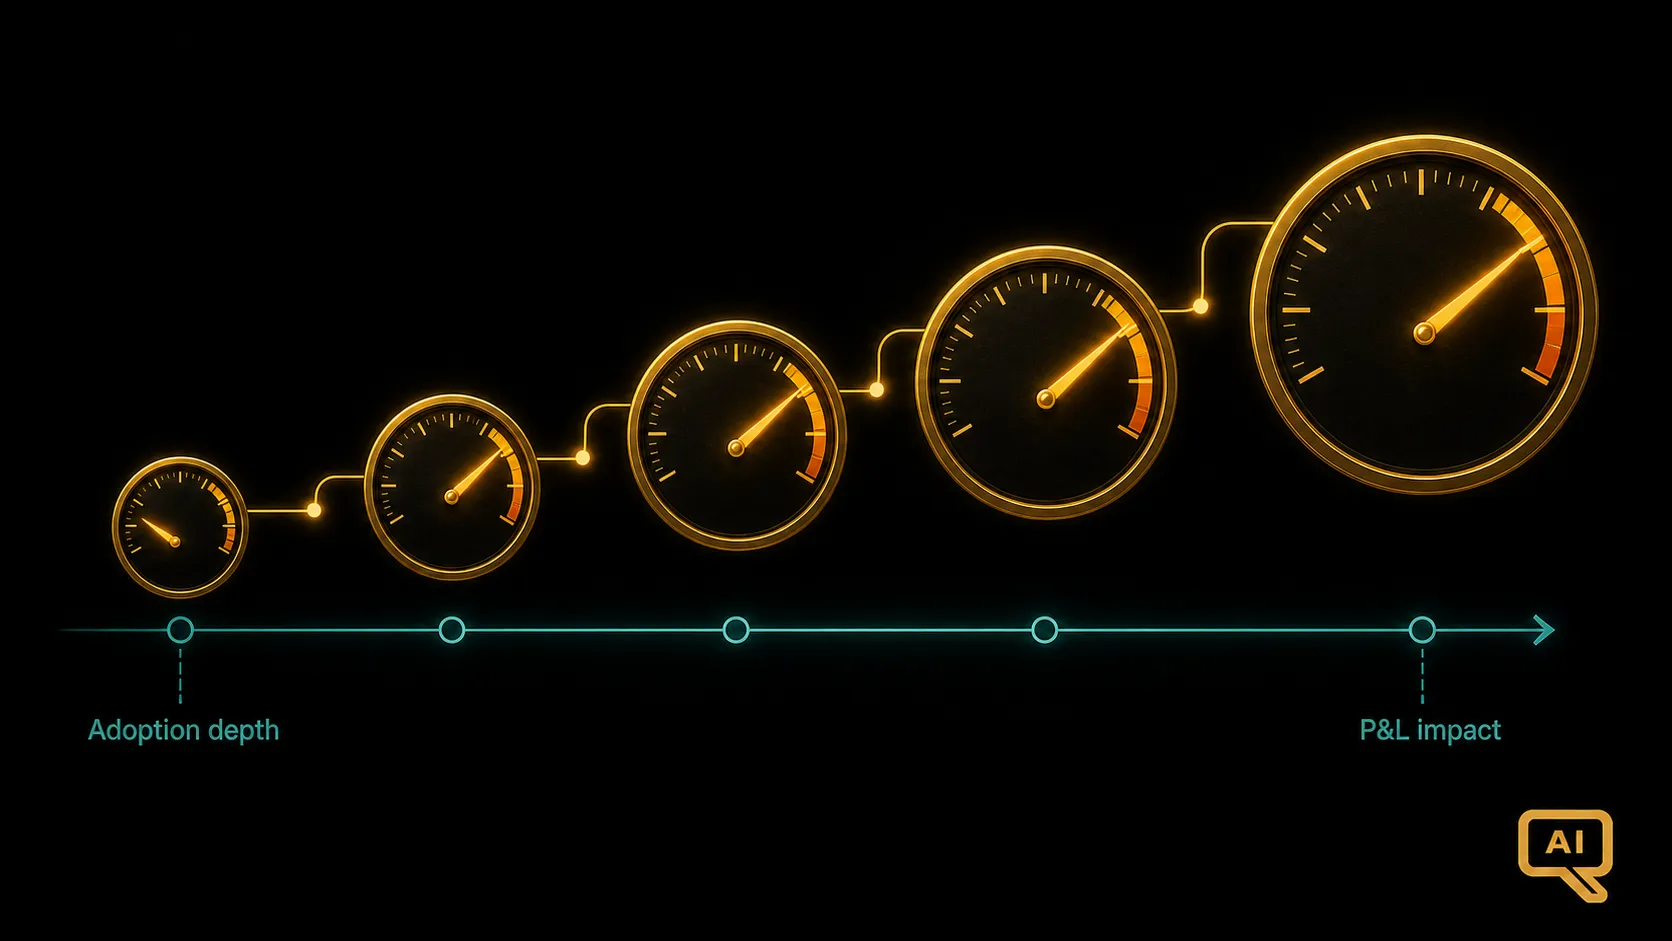
The most dangerous period in an AI programme is the eighteen months after launch, when the costs are real, the value is invisible, and everybody in the room has an opinion about whether to double down or shut it down. The J-curve I described in BCR-01 is the shape of that period. What determines whether you survive it is not the underlying value creation. It is whether you can see the value creation before the P&L catches up.
That is what leading indicators are for. They are the early signals that predict future outcomes, and for AI programmes they are not optional. Without them, you are flying blind through the exact period where the decisions that matter most are getting made.
The distinction that gets forgotten
A lagging indicator measures a result that has already happened. Revenue growth. Cost reduction. Customer retention. Margin improvement. These are the outcomes finance cares about, and they are the outcomes any credible business case is ultimately measured against.
A leading indicator measures something that predicts the future value of a lagging indicator. Adoption depth. Quality scores. Cycle-time reduction on specific workflows. Cost per successfully completed task. These do not show up in the annual report, but they change months before the annual report does.
The reason the distinction matters for AI is that lagging indicators arrive late by construction. Individual users adopt the tool. They save some time. That saved time gets redeployed into other work. That other work eventually produces different business outcomes. Each of those transitions takes time, and each of them is where value can leak. If you wait for the P&L to move before you have evidence the programme is working, you will wait too long, and by then the decision to continue investing will have already been made without data.
The measurement cascade
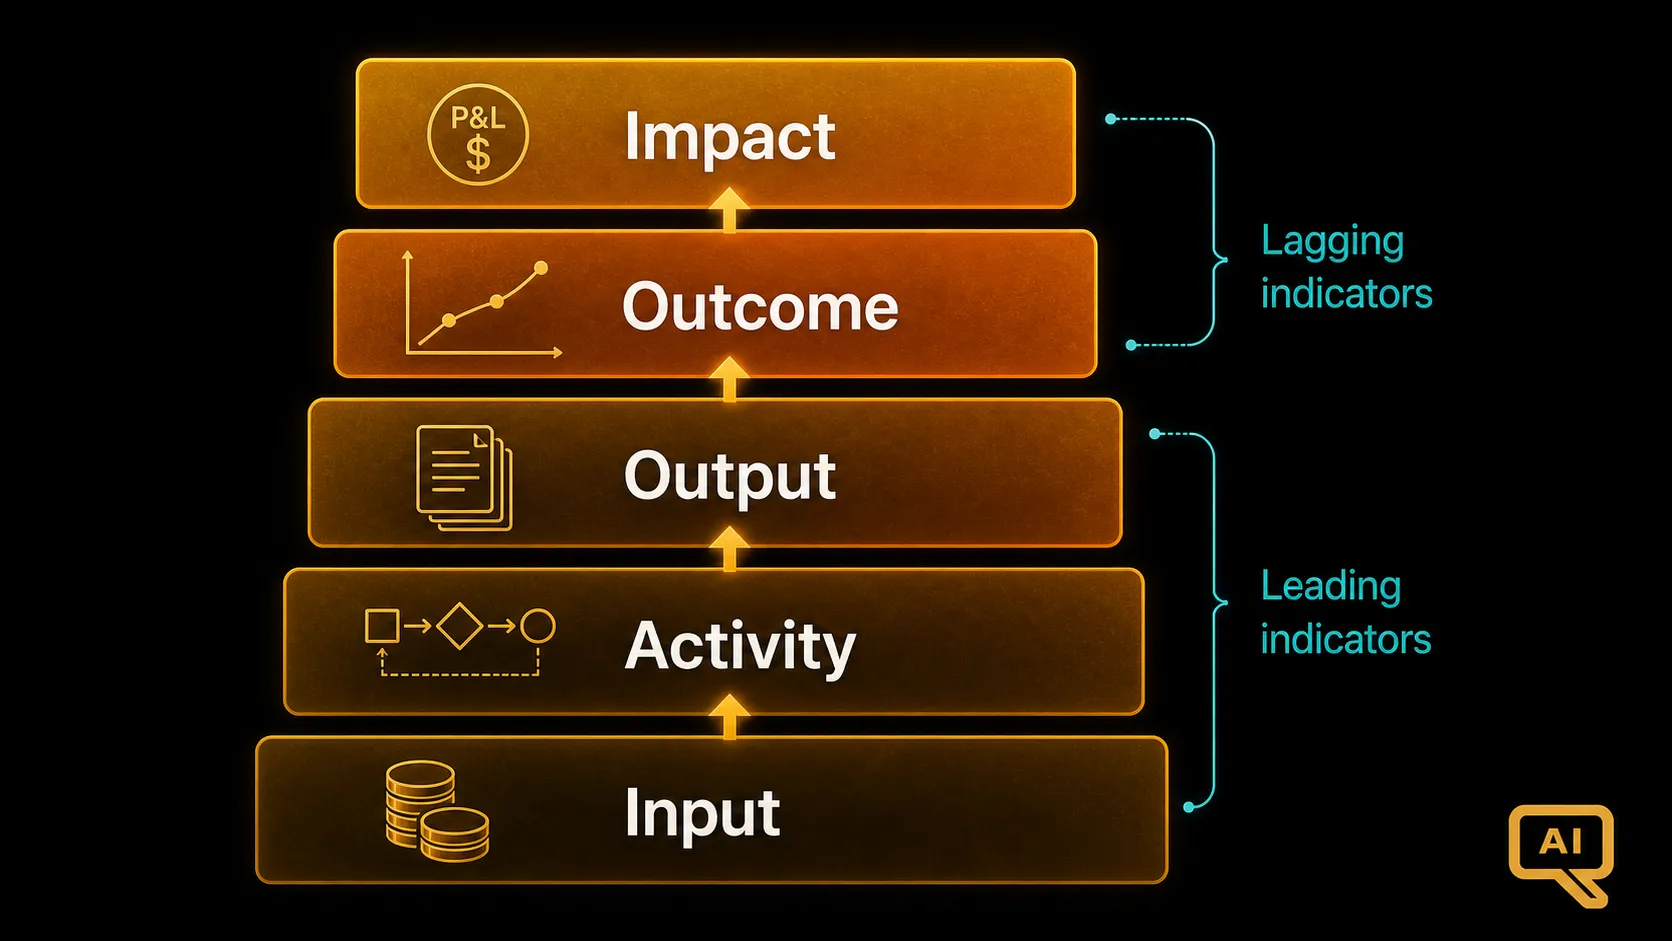
Figure 1 shows how I stack measurement for an AI programme. Five tiers from input to impact, with leading and lagging indicators distributed across them.
Inputs are what you put in. Model licences, engineering time, change management effort, training investment. These are the earliest signals, but they only tell you the programme is active, not that it is working.
Activity metrics measure what people do with the tool. Sessions, prompts sent, features used, workflows initiated. These are the first signs of adoption. They are necessary but not sufficient. High activity with no output improvement is a red flag, not a success signal.
Output metrics measure what the tool produces. Cases resolved, documents drafted, tickets handled, code generated. These start to connect activity to work getting done. They are where most AI programmes should be focusing their measurement effort in the first six months.
Outcome metrics measure how the work has changed. Faster cycle times, higher first-pass quality, lower escalation rates, better customer satisfaction on the specific workflows the tool touches. These are the first signals that the tool is not just being used, but is changing the shape of the work.
Impact metrics are the lagging indicators finance recognises. Revenue attributed to the change, cost reduction booked, margin improvement measurable. These come last, and they arrive quarters after the outcome metrics have already moved.
The cascade in Figure 1 makes an important point: healthy AI programmes show movement in earlier tiers before later ones. Programmes that show impact without corresponding outcome movement usually have an attribution problem. Programmes that show outcome movement without impact movement usually have a workflow redesign problem (the saved capacity is not converting to redeployed value). Both are diagnosable if you have the cascade instrumented.
Leading indicators worth tracking for AI
Not every leading indicator is equally useful. The ones I have seen work well across enterprise AI deployments have a common shape: they predict future value, they are hard to game, and they respond quickly to the actual programme actions.
Adoption depth is the single most predictive leading indicator I have found. Not seats provisioned (which is closer to an input), not sessions per user (which is closer to activity), but the fraction of users whose weekly workflow includes multiple AI-supported tasks. Deep adoption predicts sustained value. Shallow adoption predicts churn.
Cost per successful task is the leading indicator that predicts unit economics. When it drops, the programme is getting more efficient. When it rises, either quality is deteriorating or workload complexity is expanding, and both deserve investigation. This is the metric I recommended in BCR-06 as the shift from cost per token to cost per outcome.
Quality scores on model outputs, sampled and human-scored, predict downstream trust and eventual adoption stability. Quality that degrades over time is often the first sign of drift, prompt regression, or a model refresh that changed behaviour in ways nobody caught.
Time-to-completion on the specific workflows the tool supports is the leading indicator that predicts productivity outcomes. Hours saved is the wrong version of this (I get to why in BCR-11), but time from start to complete on a defined work unit is a defensible measurement if the baseline is honestly captured.
Task complexity handled is a subtler leading indicator that predicts capability expansion. If the average task the tool handles is getting more complex over time, adoption is deepening, and the programme is on a good trajectory. If task complexity is flat, adoption is superficial.
The vanity trap
I want to be direct about which numbers look like leading indicators but are not.
Seats provisioned is not a leading indicator. It is a purchase decision. Nothing about seats says anything about value.
Tokens consumed is not a leading indicator. It is a bill. High token consumption with poor cost per successful task is worse than lower consumption with good economics.
Number of use cases deployed is not a leading indicator. Multiple half-baked use cases can be worse than a single well-executed one, especially if they consume the same platform team’s attention.
Executive mentions in earnings calls is not a leading indicator, though a startling number of organisations act like it is. Terminal X’s analysis of S&P 500 earnings transcripts in 2026 found high volumes of AI mentions but very little in the way of concrete financial metrics, and Morgan Stanley put the number of S&P 500 companies that could cite a measurable AI benefit at 21 percent. Talk is cheap; instrumentation is not.
The trap with vanity metrics is that they satisfy the pressure to show progress without providing any information about actual progress. Programmes that report on vanity metrics for six months are usually programmes that are not measuring the things that matter. When the P&L finally catches up (or does not), there is no diagnostic history to work from, because the signals that would have told you what was happening were never captured.
The instrumentation-first discipline
The single biggest predictor of whether an AI programme will have credible leading indicators is whether the instrumentation was designed in from the start. Programmes that treat measurement as something to bolt on later almost never get it right, because the events that need to be captured (baseline workflow timing, quality baselines, adoption depth) are already gone by the time anyone thinks to look for them.
MIT NANDA’s finding that 95 percent of enterprise GenAI pilots produce no measurable P&L impact is often quoted as a statement about the technology. It is more accurately a statement about measurement. The 5 percent who could show impact were disproportionately the ones who instrumented from day one. The 95 percent may have been producing value too; they just could not prove it.
The instrumentation-first discipline is not complicated in principle. Before launching a use case, capture the baseline: how the work is done today, how long it takes, what quality looks like, what the current cost is. Design the eval infrastructure that will measure quality of AI outputs in production. Set up telemetry that captures adoption depth, cost per task, and outcome metrics from the day the tool goes live. Commit to a review cadence where the leading indicators get inspected and interpreted, not just reported.
Reading the cascade in practice
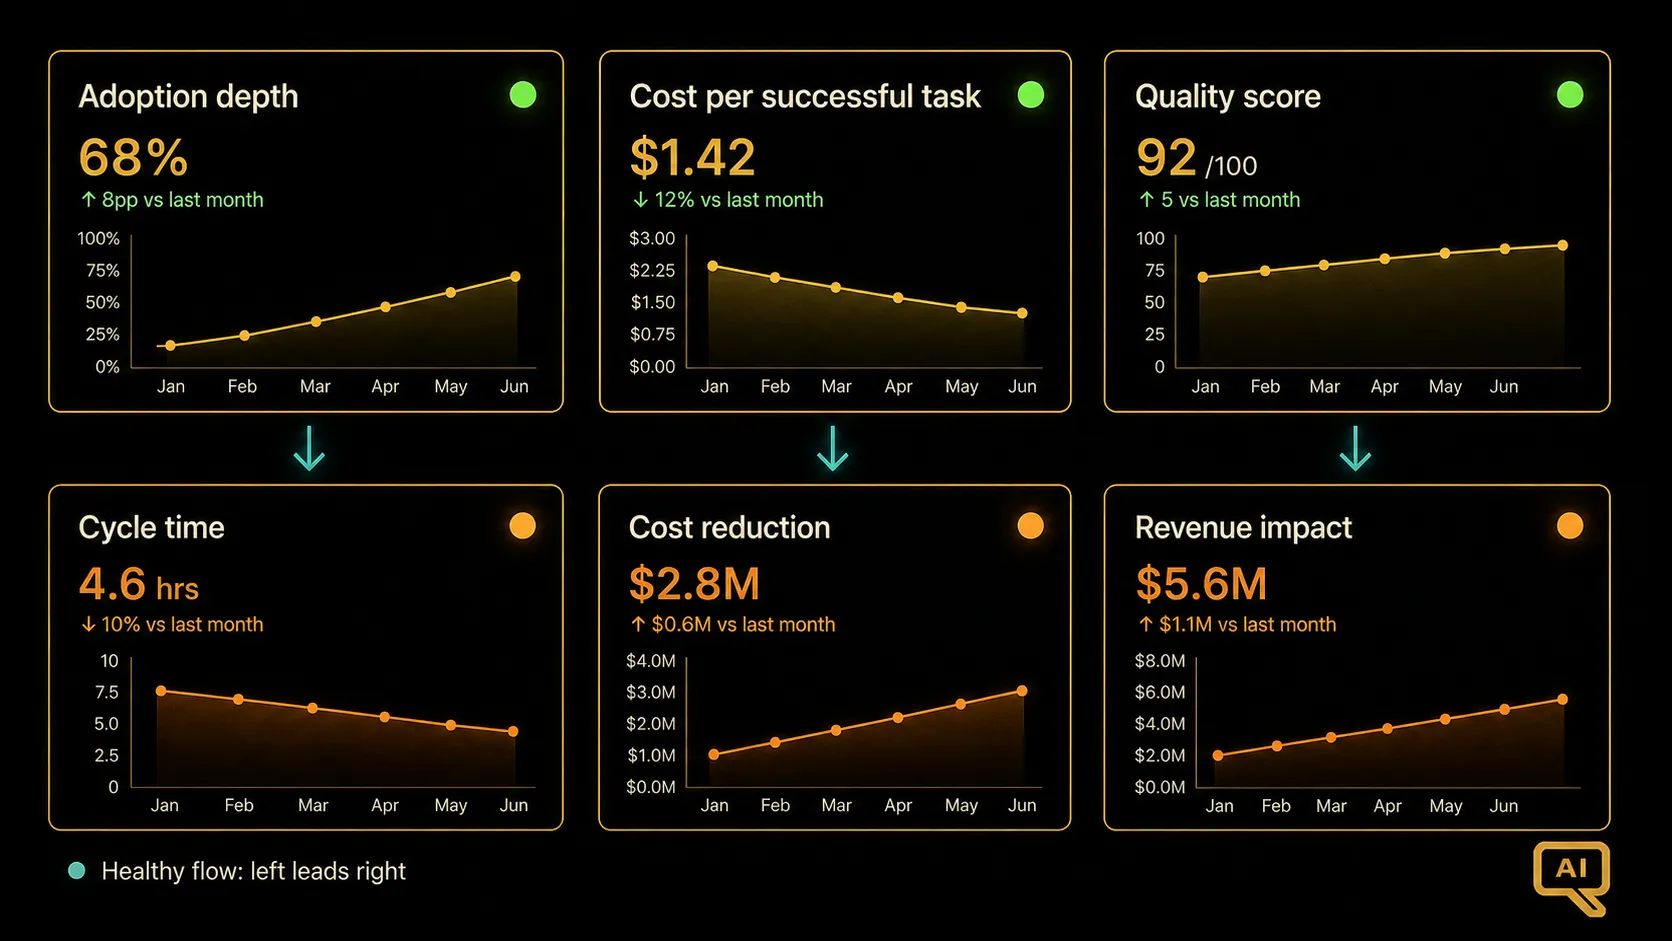
Figure 2 shows the dashboard shape I use to monitor an AI programme in its first eighteen months. The leading indicators live on the left. The lagging indicators live on the right. The arrows between them show the expected causal flow. A programme that is healthy shows movement flowing left to right over time. A programme that is not healthy shows movement stuck on the left, or (worse) claimed movement on the right that is not supported by the left.
Figure 2 is a diagnostic tool. When a lagging indicator moves in a direction you did not expect, the leading indicators should tell you why. When a lagging indicator does not move despite good leading indicators, something has broken in the causal chain (usually adoption depth or workflow redesign), and the specific gap becomes visible.
The management discipline
Leading indicators only matter if leadership actually uses them. I have seen too many programmes with excellent instrumentation and no forum for interpreting the signal. The dashboard exists, the numbers are current, and nobody is making decisions based on them.
The management discipline that makes leading indicators productive has a monthly rhythm at minimum. Someone owns the interpretation. Someone else has the authority to change course. Decisions are logged, along with the leading indicator movements that triggered them. Over time, the organisation gets calibrated: it learns which signals predict which outcomes in its specific context, and its ability to steer the programme improves.
That calibration is the underrated benefit of leading-indicator discipline. Not just that you can see the value coming, but that your organisation gets better at knowing where to look and what to do about what it sees. In BCR-10 I get into the related problem of proving that the value you are seeing was actually caused by the AI, which is where the leading indicators feed into the attribution question that ultimately determines whether finance will underwrite the claim.