
I have spent sixteen articles in this track walking through how to build AI business cases that survive contact with reality. I want to close by walking through the specific ways cases fail, because knowing the failure patterns is often more useful than knowing the success patterns. Success in AI programmes has many shapes. Failure has a small number of recurring shapes that show up so consistently they deserve to be named and inoculated against.
The numbers frame the stakes. RAND puts AI project failure rates above 80 percent. MIT NANDA puts the fraction of GenAI pilots producing no measurable P&L impact at 95 percent. S&P Global found 42 percent of companies abandoned most of their AI initiatives in 2025. Gartner projects 40 percent of agentic AI projects will be cancelled by 2027. These are not statistics about the technology. They are statistics about how organisations approach the technology, and every one of them is a pattern you can watch for and design around.
Pilot purgatory
The most named pattern of 2026 is pilot purgatory. An organisation launches AI pilots. The pilots deliver interesting technical results. The pilots do not graduate to production. Six months later, more pilots start. The first pilots are still “ongoing.” The board asks for an update. Leadership presents a slide of pilots. None of them are actually running the business.
The estimates vary but converge: some analyses put the rate of pilots reaching production as low as 10 to 15 percent. The 80 to 95 percent that stall have specific shared characteristics. No pre-agreed success criteria, so evaluation becomes political. Data infrastructure that supported the pilot but cannot support production scale. Champions who moved on to other roles before graduation happened. Organisational systems that had no place for the pilot’s output.
The inoculation is the discipline described in BCR-02: every pilot needs a charter that defines success criteria, evaluation timeline, and scale-or-kill decision structure before the first line of code gets written. Open-ended exploration without a fixed evaluation date is the structural mechanism that produces pilot purgatory. Charters kill it.
Vanity metrics
The second recurring pattern is measuring activity as if it were outcome. Number of employees using the tool. Number of API calls processed. Number of use cases deployed. Executive mentions of AI in earnings calls. These get reported as if they are progress; they are not.
The trap is that vanity metrics satisfy the pressure to show progress in the periods where real outcome metrics have not yet moved. A programme in month four is in the J-curve flat zone, and reporting “we deployed six use cases and 2,400 employees are using the tool” is politically much easier than reporting “we have not yet seen movement in customer satisfaction, cycle time, or cost per resolved case.” So the vanity numbers get reported. And when the P&L eventually fails to catch up, the vanity numbers turn out not to have been evidence of anything, and the credibility of the whole programme goes.
BCR-09 covered the leading versus lagging indicator distinction that inoculates against this. The specific vanity metrics to watch for and refuse to lead with are: seats provisioned, sessions per user without depth data, tokens consumed, use cases launched, and executive references. All are valid to track. None are safe to lead with.
The 95 percent statistic misused
The MIT NANDA finding is the most cited data point in enterprise AI. It gets used two ways, and both are wrong.
The first misuse is treating it as evidence that AI is broken. The MIT paper carefully measures what happened at 95 percent of the organisations they studied. It does not claim the technology is incapable of producing value; it says the majority of organisations are not currently producing measurable value with it. Those are different claims.
The second misuse is treating it as a target: “we can be in the 5 percent.” Business cases sometimes claim they will beat the 95 percent by doing better execution. Better execution is necessary, but the 5 percent is not primarily separated from the 95 percent by execution quality alone. It is separated by specific structural choices: instrumentation from day one, external partnerships over pure internal builds, back-office focus over front-office ambition, workflow redesign over tool-bolting. The business case should show which of those choices you are making, not just claim you will execute well.
Cost sprawl
The third recurring pattern is unmanaged experimentation across the organisation. Teams start using AI tools without coordination. Multiple tools get bought without consolidation. Individual expenses under approval thresholds add up to material spend that no one is tracking. The MIT NANDA data on shadow AI (over 90 percent of employees using personal AI tools regardless of official programme status) captures the pattern.
Cost sprawl is not always bad. Some of the most useful AI adoption happens through bottom-up experimentation, and organisations that shut this down entirely end up worse off than organisations that let it happen. The failure mode is not the experimentation. It is the organisation that never captures the learnings, never migrates the successful patterns to sanctioned tooling, and never brings the total spend into visibility.
The inoculation is the FinOps discipline from BCR-15. Instrument first. Attribute to teams. Report the total. Make sanctioned tooling attractive enough that teams choose it over shadow tools. Guardrail the specific risks (data leakage, regulatory exposure) rather than trying to block all experimentation.
Overpromised savings, underdelivered redeployment
BCR-11 dealt with the “hours saved” trap at length. The specific business case failure it produces is the case that claims $8 million in productivity value from AI copilots and delivers it as saved hours that never converted to any measurable enterprise outcome. Six months later, the P&L is unchanged, the case is being questioned, and nobody can explain where the saved hours went.
The pattern is so consistent that I now treat any business case with a hours-saved calculation as suspect until it also has a redeployment plan. What specific work will the saved capacity be used for? Who owns making that redeployment happen? What will you measure to prove it did? Cases with credible answers to those questions can defend their numbers. Cases without them cannot.
Science fair pilots
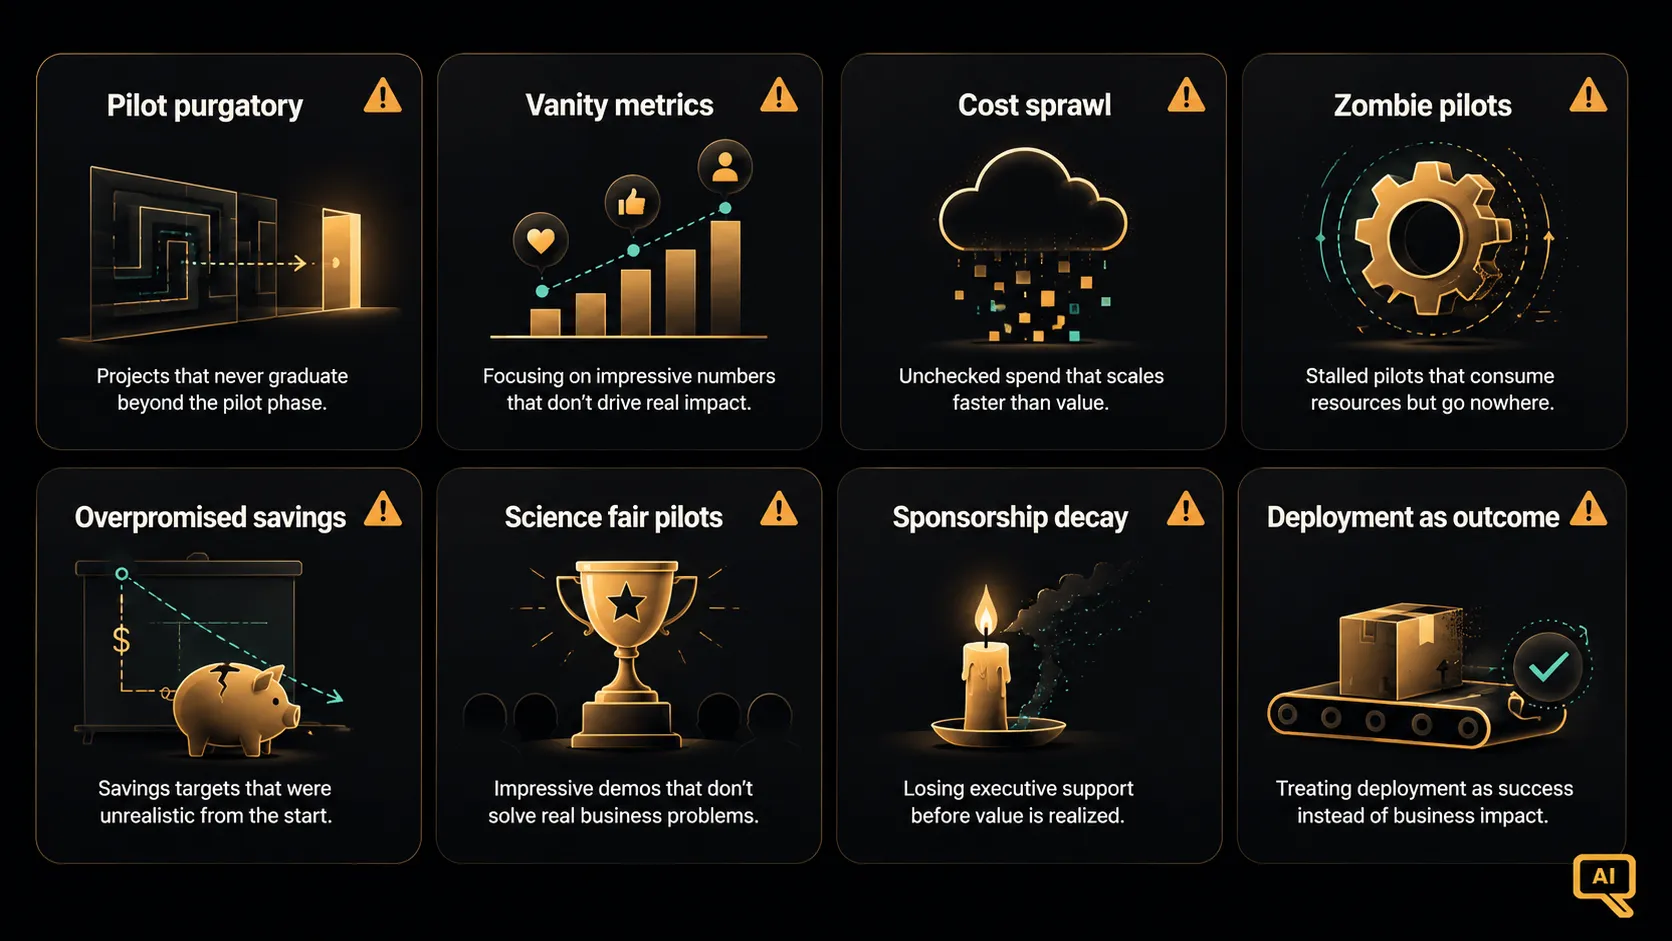
Figure 1 organises the failure modes as a taxonomy for quick reference. Looking at Figure 1, science fair pilots are the mode I want to name specifically because they are the most seductive.
A science fair pilot is a high-visibility deployment designed to impress rather than to transform. It gets picked because it demos well, not because it produces business value. It gets funded because it makes the leadership look forward-thinking. It runs in a curated environment with hand-picked data and hand-picked users. It produces a compelling case study for the board and then quietly does not scale.
The tell is that the pilot’s success criteria were defined in terms of what could be shown, not in terms of what could be measured against a business baseline. If the pilot ended with a slide deck instead of an operational metric, it was probably a science fair pilot. The pattern is well documented in the Pilot Purgatory Index research from 2026: pilots designed for impression rather than transformation trap organisations in a cycle of visible progress with no operational reality.
Zombie pilots
Related but distinct: the zombie pilot is one that never quite dies. It has been “almost ready” for the last three quarters. The team is “still training the model on proprietary data” or “refining the algorithm.” Nobody wants to kill it because it might work someday. Nobody wants to scale it because it clearly does not work today. It consumes resources indefinitely.
The rule of thumb I use: if a pilot has been “almost ready” for more than two quarters, it is a zombie. The kindest thing you can do is stop it. Redeploy the team. Free the budget. Do the next pilot with a proper charter.
Executive sponsorship decay
The fifth pattern is longer-lived and harder to see: the sponsor who championed the programme moves on, gets promoted, or shifts focus, and the programme quietly loses its air cover. New leadership does not have the same investment in the programme’s success and starts questioning its value. Fewer resources get committed. The measurement rhythm slows. Twelve months later, the programme is a low-priority initiative nobody defends.
Sponsorship decay is inevitable in any long-running programme. The inoculation is not to prevent it (you cannot) but to design for it. The programme should be structured so it produces value that stands independently of the sponsor. The measurement should be legible to any new leader who inherits it. The governance should include multiple senior stakeholders, not just the original sponsor. Programmes that are one-person-deep on sponsorship are fragile in ways that only become visible when the person leaves.
The “we already deployed AI” trap
The final pattern is subtle. An organisation deploys AI, celebrates the deployment, and then treats the deployment as the outcome. Six months later, the tools are running, the vendors are being paid, but no one is instrumenting whether the deployment is producing value. If asked, leadership will say “we deployed AI.” That is not an outcome; that is an activity.
The Morgan Stanley finding that only 21 percent of S&P 500 companies could cite a measurable AI benefit is largely this pattern at scale. Deployment is not delivery. Delivery is measured value creation, and measured value creation requires the full instrumentation and attribution discipline covered throughout this track.
The warning signs checklist
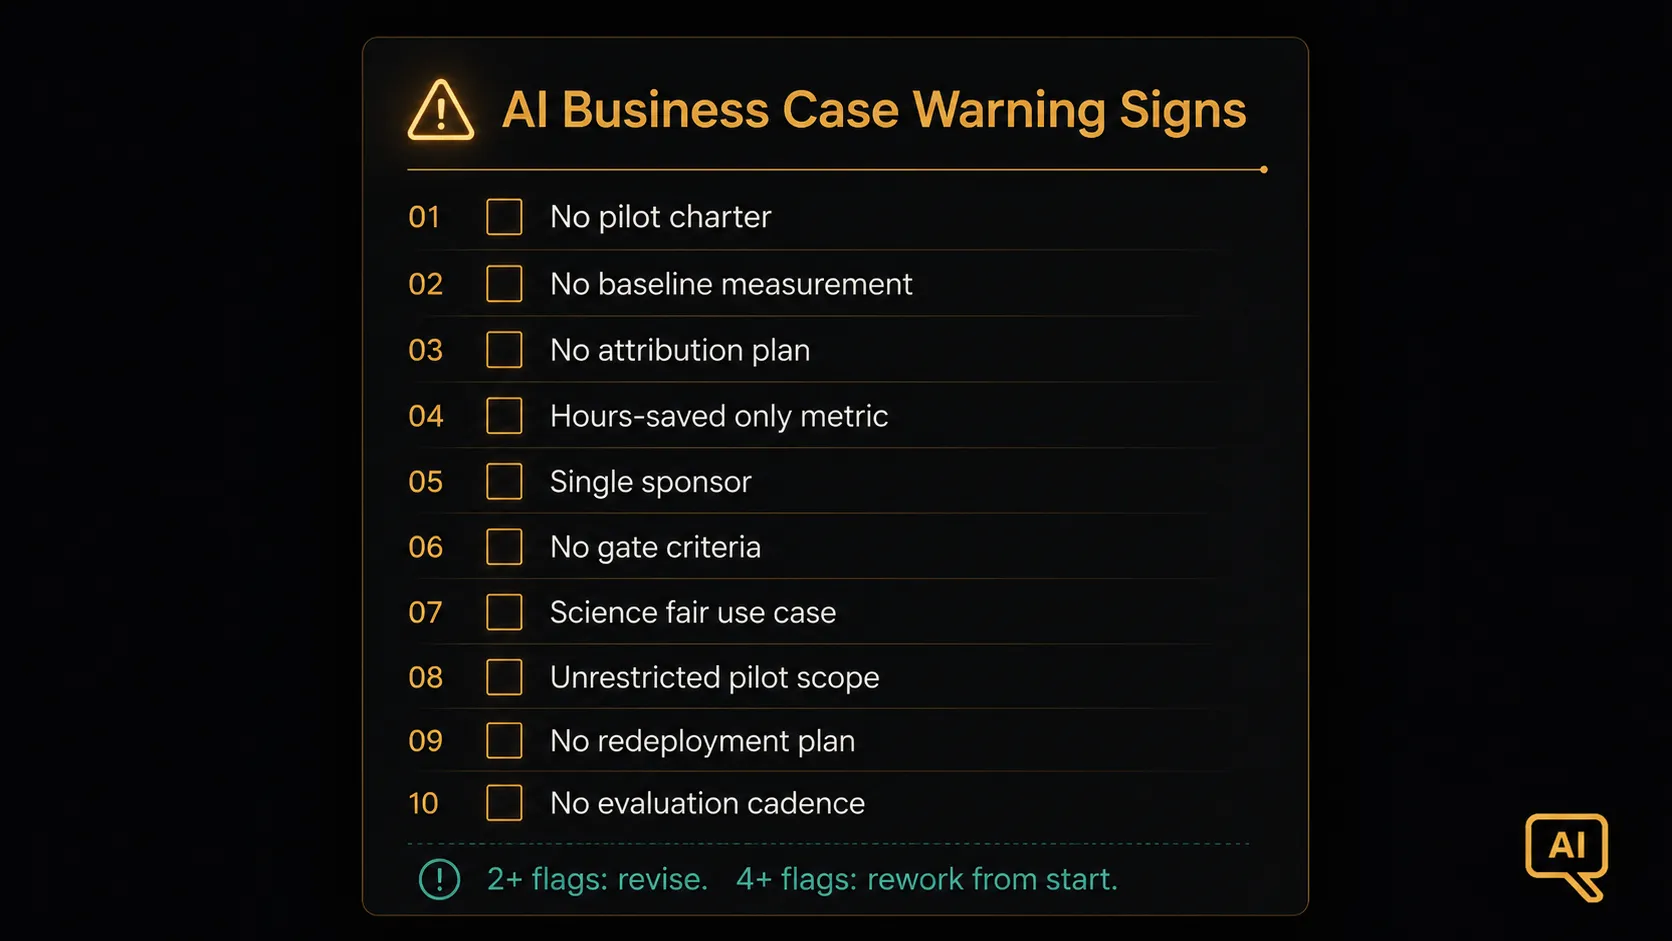
Figure 2 shows the specific checklist I run through when reviewing an AI business case. Ten warning signs, each mapped to one of the failure modes above. If more than two are present, the case needs significant revision. If more than four are present, the case is likely to produce one of the failure patterns and should be reworked from the start.
The warning signs in Figure 2 are the actionable version of everything covered in this track. No pilot charter with pre-agreed success criteria (BCR-02). No baseline measurement of current-state metrics (BCR-09). No attribution plan for how value will be causally established (BCR-10). Only hours-saved as the productivity metric (BCR-11). A single executive sponsor with no succession plan. No gate criteria for staged investment (BCR-08). A science-fair use case chosen to impress rather than to produce measurable value. Pilot scope that has expanded during planning without corresponding budget increase. No plan for what saved capacity will be redeployed to. No cadence for evaluating leading indicators and adjusting course.
The one lesson
If I had to reduce the whole track to one lesson, it would be this: AI business cases fail more often for measurement and structural reasons than for technology reasons. The models work. The tools are capable. The value is real for organisations that design for it. What separates the 5 percent that capture value from the 95 percent that do not is almost entirely the discipline of business case construction, measurement, attribution, and staged execution.
That discipline is not exotic. Every practice covered in this track (from BCR-01’s J-curve awareness through BCR-16’s presentation structure) is available to any organisation willing to apply it. The gap between the AI winners and everyone else is not access to models. It is willingness to do the hard, unglamorous work of instrumentation, honest measurement, and staged commitment.
The good news is that the discipline compounds. Organisations that build the first credible AI business case, run it to disciplined delivery, and use the results to inform the second case get progressively better at this. Organisations that keep repeating the same failure patterns keep producing the same failed programmes. The choice is a leadership choice, not a technology choice, and it is available to anyone willing to make it.
That is the end of the Business Case and ROI track. What comes next is applying the discipline to specific decisions, specific programmes, and specific contexts, which is where the rest of QuickAILab’s tracks come in.