
Something changed after you deployed the AI system. Customer satisfaction went up. Handle time went down. Deal cycle shortened. The team is happier. The numbers look good.
Was it the AI?
That question is the attribution problem, and it is the one that separates business cases finance will underwrite from business cases finance will humour. Morgan Stanley’s 2026 analysis found that only 21 percent of S&P 500 companies could cite a measurable AI benefit. That statistic is not primarily a measurement failure. It is an attribution failure. Companies are seeing changes in their businesses and cannot credibly say the AI caused them.
I want to walk through this problem seriously, because it is one of the least glamorous parts of AI programme management and one of the most consequential.
Why attribution is unusually hard for AI
Standard IT ROI has a natural attribution structure. When you replace an old CRM with a new one, the users, the workflow, and the outcome are relatively contained. If sales productivity improves in the same quarter, it is reasonable to associate the two.
AI does not sit that way. AI tools spread across workflows, sit alongside human decisions, and interact with dozens of other things that are also changing. In any real enterprise, the same quarter you deployed a support copilot, you also probably updated the customer knowledge base, tweaked pricing, ran a training programme, adjusted staffing, and lived through some macroeconomic weather. Any of those could be moving your metrics.
There is also a subtler attribution problem specific to AI: the effect is often distributed across many small decisions rather than concentrated in a few big ones. A copilot that helps agents write slightly better responses across ten thousand tickets does not create a moment where you can point at a specific ticket and say “the AI saved us money on this one.” The value is real and it is aggregate, but the causal chain is diffuse.
The counterfactual is the whole game
Every attribution question reduces to the same underlying counterfactual: what would have happened without the AI? Everything that follows is about how confidently you can answer that.
The gold-standard answer is a randomised controlled trial. You randomly assign users, teams, or accounts to a treatment group (gets the AI) and a control group (does not), and you compare outcomes. If done correctly, the difference is causal. This is the same logic clinical trials use to test drugs.
For AI programmes, running a proper RCT is often difficult but rarely impossible. The main obstacle is not statistical; it is political. Leaders often want everyone to get the tool immediately, and asking a control group to wait feels like withholding value. But if you cannot answer the counterfactual, you cannot claim the value, and the executive team that pushes back on randomisation is the same one that six months later cannot tell the board whether the programme worked.
The rollout designs that enable attribution
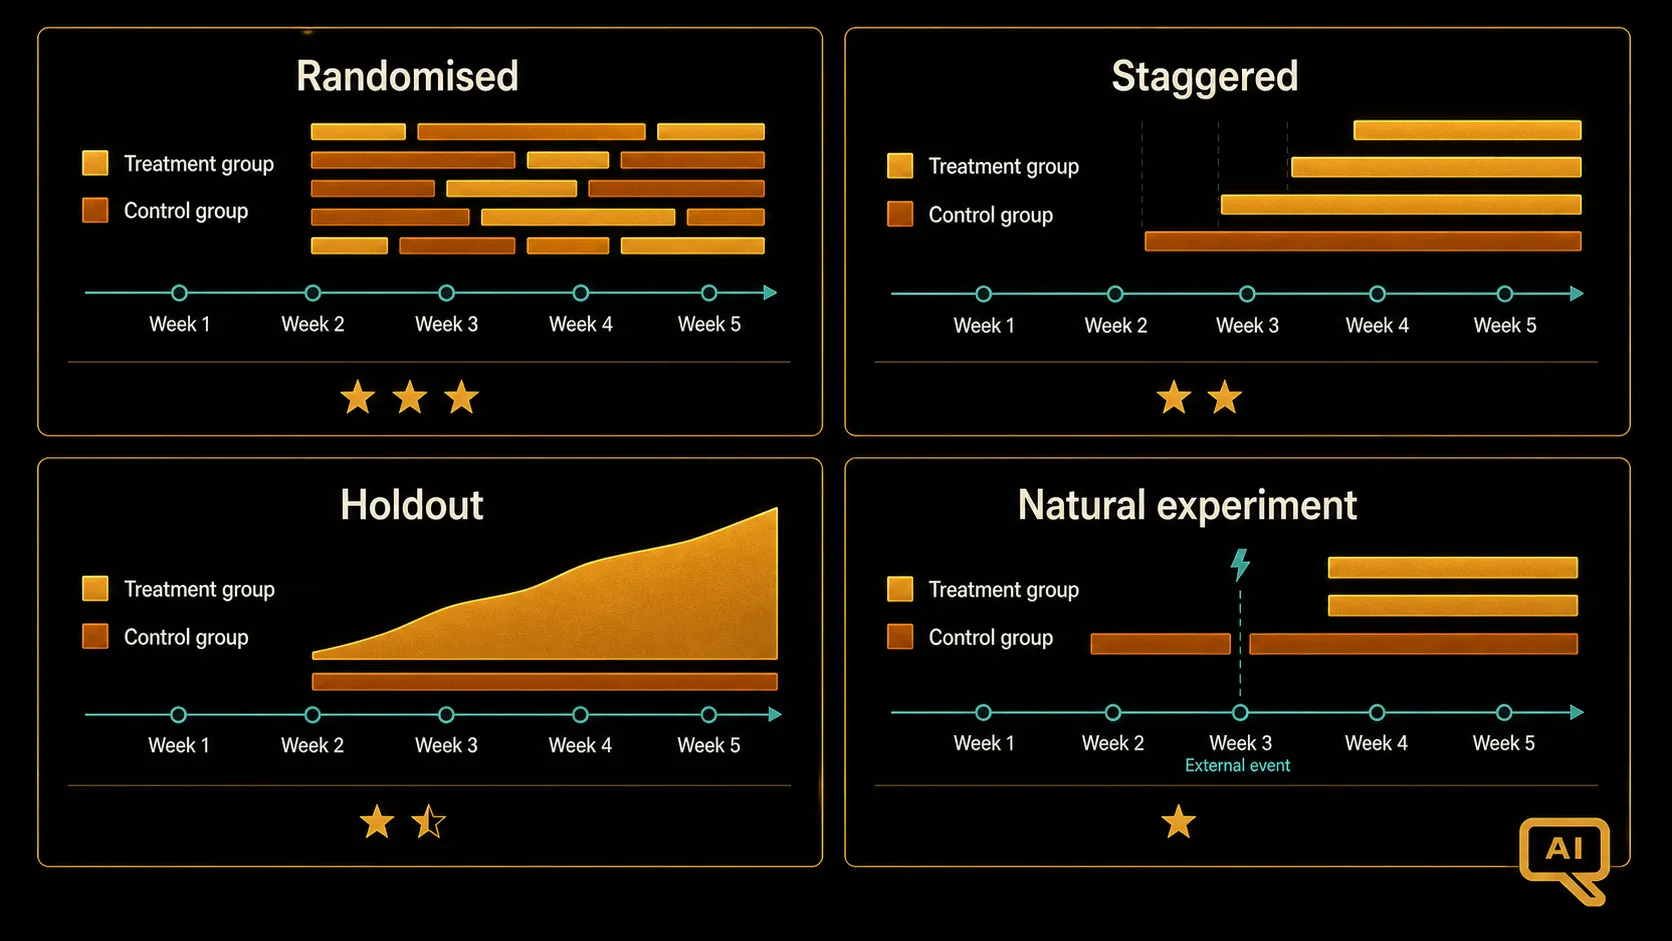
Figure 1 organises the four rollout designs that make attribution possible, ranked by the confidence they support.
Randomised rollouts, at the top of Figure 1, assign users to treatment and control at random. This is the strongest design, and it should be the default for any AI investment large enough to matter. Randomisation does not have to be individual; you can randomise at the team, region, or customer-segment level, which is often more practical.
Staggered rollouts deploy the tool to different groups in sequence over time. Early groups become the treatment; later groups act as controls until they too get the tool. This is a very underused design and it is often achievable when a full RCT is not, because it aligns with how enterprises typically want to roll out anyway (start small, expand). The comparison is the outcome trajectory of early-adopter groups versus later-adopter groups during the window when only some of them had the tool.
Holdout designs keep a specific segment of users off the tool indefinitely. This is stronger for long-term attribution but harder to sustain politically. It works best when the holdout is small enough to be affordable and the segment can be plausibly matched to the treatment population.
Natural experiments exploit external events that create quasi-random variation in exposure. A vendor rollout that hit some regions before others. A feature that was available to certain licence tiers only. A hiring pattern that meant one team had experienced AI users and another did not. Natural experiments are weaker than deliberate designs, but they are often the only tool available for retrospective analysis, and they can be surprisingly powerful when the natural variation is genuine.
Before and after is almost always wrong
The default attribution method most AI programmes use is the “before and after” comparison. Measure the metric before deployment, measure it after, claim the difference as the value.
This is almost always wrong for one simple reason: many things change over time other than the AI deployment. Seasonality moves metrics. Product changes move metrics. Team composition moves metrics. The macro environment moves metrics. Before-and-after conflates all of these with the AI effect, and the conflation typically flatters the AI (because programmes tend to launch during periods of positive momentum) but sometimes penalises it (if the launch coincided with an unfortunate external shock).
A stricter version of before-and-after uses a matched comparison group: teams or accounts that look similar to the treatment group but did not receive the tool. This is better than pure before-and-after, but it inherits the standard selection problems: the matched group is not truly comparable if the reason they did not receive the tool is correlated with the outcome.
For business cases finance will actually underwrite, before-and-after should be a red flag. If that is the only evidence you can offer, expect the value claim to be discounted heavily.
The attribution confidence hierarchy
I use a rough hierarchy when evaluating how much confidence to place in an attribution claim. Randomised experimental evidence gets full weight. Staggered rollout with careful controls gets 70 to 80 percent weight. Natural experiments get 50 to 70 percent weight depending on the strength of the natural variation. Matched comparison gets 30 to 50 percent weight. Before-and-after gets 10 to 20 percent weight, mostly as directional evidence rather than proof. Pure user testimonials and case studies get less than that.
The point of the hierarchy is not to make attribution punitive. It is to be honest about what the evidence supports. A programme with strong before-and-after evidence has some evidence, and it can be worth continuing to invest. It just does not have the evidence to make finance-grade claims of value at the levels the raw numbers suggest.
Attribution decay: even good designs get harder
Even when you start with a strong attribution design, the ability to attribute erodes over time. As the treatment group’s improvements become common knowledge, the control group starts changing behaviour in ways that mimic the treatment. As the tool becomes widely adopted, the counterfactual becomes hypothetical rather than observable. As workflows are redesigned around the AI, the pre-AI baseline stops being a meaningful reference point.
This means attribution is a use-it-or-lose-it discipline. The window to establish causal evidence is early in the deployment, when treatment and control still meaningfully differ. Once the tool is universal, the counterfactual is gone, and any claim about total value has to lean on the attribution you established while there was still something to attribute against.
The practical implication is that the first six to twelve months of an AI deployment are the most important measurement window in the programme’s life. The instrumentation you set up during that window will still be defensible five years later. The instrumentation you neglect will leave a gap that no amount of after-the-fact analysis will fill.
The politics of attribution
Attribution is not just a technical problem. It is a political one. Executives who championed a programme have strong incentives to claim credit for anything positive that happened around it. Executives who opposed it have equally strong incentives to attribute positive changes to something else. Neutral parties do not always exist, and even when they do, they often lack the data to arbitrate.
The organisational solution to this is to establish attribution methodology before the results are in. If everyone agrees in advance that the programme will be evaluated based on a specific rollout design with specific metrics measured in specific ways, the debate about what the results mean gets much shorter. If the methodology is negotiated after the fact, the methodology itself becomes the terrain of the political fight.
I have watched programmes that produced genuinely strong results get killed because the attribution methodology was not agreed upfront and the debate consumed the programme’s credibility. I have also watched programmes with weak results survive because their sponsors successfully redefined the metrics that mattered mid-flight. Neither outcome is good governance.
What a defensible attribution claim looks like
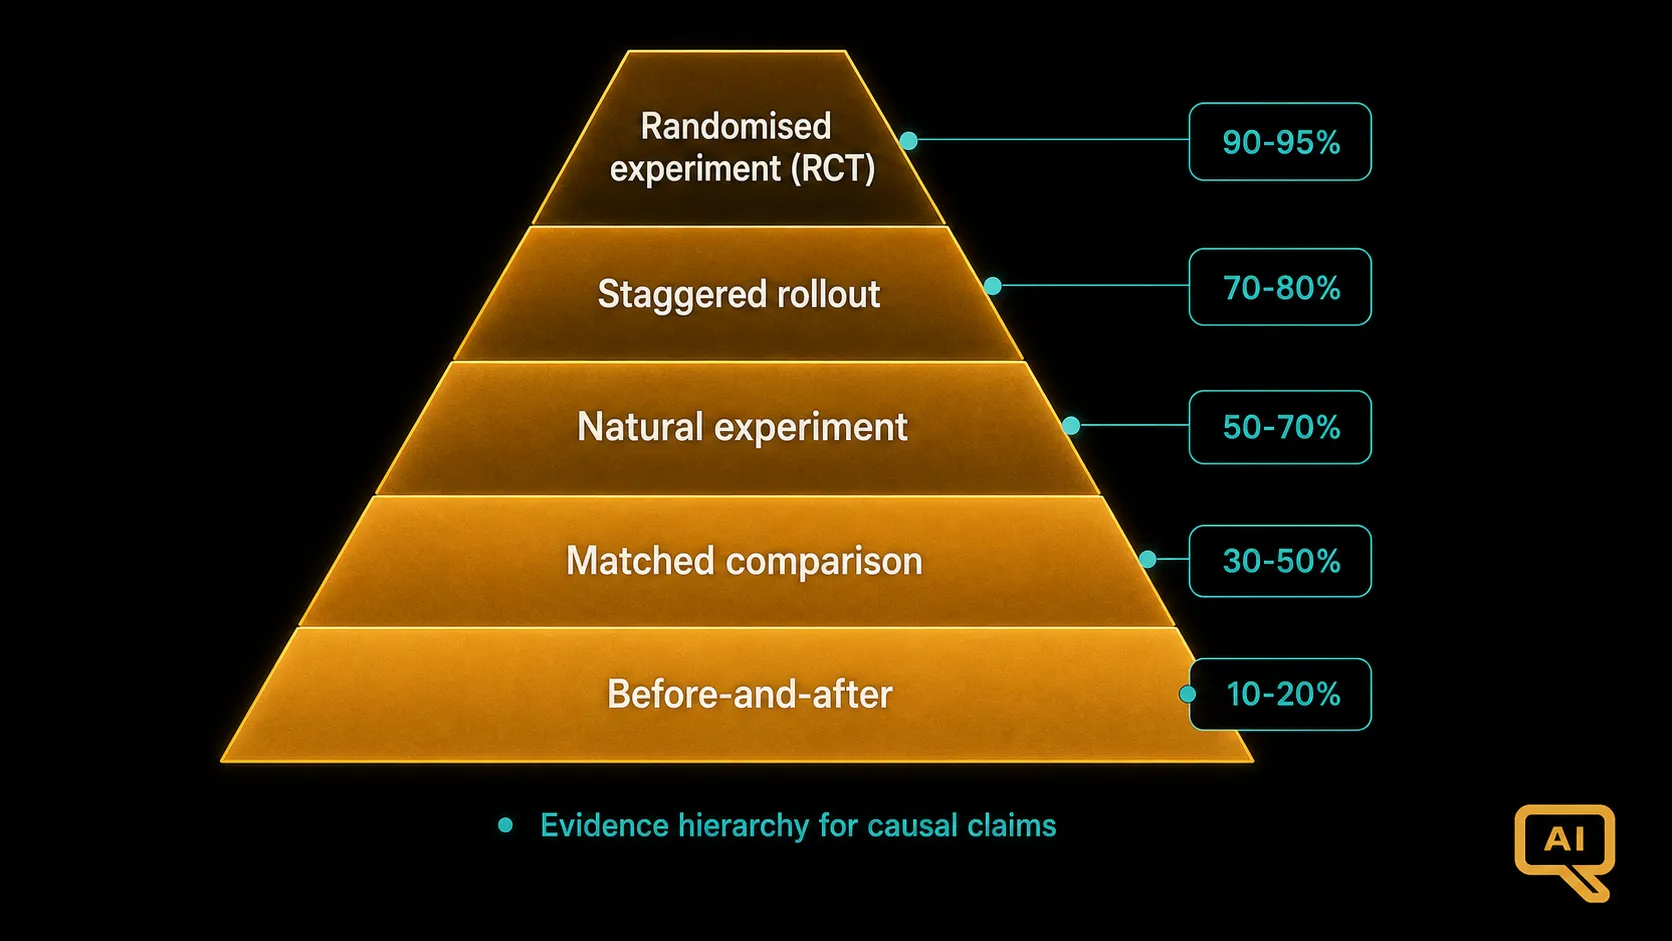
Figure 2 illustrates the confidence hierarchy in the shape I usually present it. A defensible attribution claim sits at or near the top of the pyramid in Figure 2. It states the design used, the population studied, the outcome measured, the estimated effect, and a confidence interval. It acknowledges the limits: what the design cannot prove, what other explanations remain possible, how the effect might vary across segments not covered.
If your value claim is going to a CFO or a board, that is the shape of claim they should see. Anything softer than that gets discounted, and rightly so. The 79 percent of S&P 500 companies who cannot cite measurable AI benefits are not lacking value. They are lacking evidence, and evidence is what finance underwrites.
The good news is that establishing attribution is a solvable problem. It requires deliberate rollout design, disciplined baselines, and honest interpretation of results. None of those are exotic. What they require is the willingness to set them up before you need them, which is a leadership choice more than a technical one.