
The most quoted number in enterprise AI is “hours saved per week.” Somebody surveyed the team, aggregated the responses, multiplied by hourly cost, and produced a headline value figure. The number is almost always big. It is almost always wrong.
Not wrong in the sense that the hours are not really being saved. The individual time savings from AI tools are typically real. Wrong in the sense that “hours saved” is a terrible proxy for enterprise productivity, and business cases built on it consistently overstate the return.
I want to spend this article on why “hours saved” is such a trap, and what to measure instead. This is one of the biggest gaps between the individual productivity story (which is almost universally positive) and the enterprise value story (which the MIT NANDA data puts at 95 percent no measurable P&L impact). Closing that gap starts with better measurement.
What “hours saved” actually measures
When you ask a knowledge worker how much time an AI tool saves them, you get a rough estimate of the time they perceive not spending on some specific task. Say a marketing manager reports saving four hours a week on drafting. What that number actually tells you is:
Four hours of drafting activity has been replaced (partly or wholly) by a shorter activity that uses the AI tool. The total time to complete the drafting is now lower than it was before.
What it does not tell you is:
Whether those four hours got used on something else valuable to the business. Whether the drafting quality is now higher, lower, or the same. Whether the drafting throughput went up (more drafts) or stayed the same (same drafts, more slack). Whether the tool changed which kinds of drafts the team could take on.
The gap between what “hours saved” measures and what it purports to measure is where AI productivity claims fall apart under scrutiny. Deloitte’s 2026 State of AI report captured this precisely: 66 percent of organisations report productivity and efficiency gains, but only 20 percent report actual revenue growth, and the gap is largely the productivity claims not converting to cashable outcomes.
The redeployment question
The single most consequential question when evaluating “hours saved” is: what happened to the saved hours?
There are five possible answers, and they have wildly different value implications.
The first is that saved hours got used for higher-value work the person was previously not able to do. This is the best case, and it is where AI actually generates enterprise value. The marketing manager who used to spend hours on rote drafting now spends that time on strategic campaign design, and the business ships better campaigns as a result.
The second is that saved hours got redistributed as increased throughput of the same work. The team now handles more drafts, more tickets, more cases. This shows up in enterprise metrics as capacity expansion, and it is real value if capacity was the constraint.
The third is that saved hours reduced headcount need. Instead of hiring three more people, the team could handle the growth with the existing headcount. This is real value, but it requires the organisation to actually not hire, which is a discipline most organisations do not have.
The fourth is that saved hours got absorbed as slack. The person is less stressed, takes longer breaks, spends more time on lower-priority tasks. This may be genuinely valuable for retention and quality of work life, but it does not show up in the P&L.
The fifth is that saved hours produced more low-quality output. The team now ships more drafts, but the drafts are worse, and downstream teams do rework, or customers complain, or errors compound. This is negative value dressed up as productivity.
Business cases that assume the first two outcomes and get the fourth or the fifth are the reason productivity claims and P&L impact diverge. The measurement discipline has to distinguish between them.
Individual productivity is not enterprise productivity
There is an important scale issue in AI productivity measurement. Individual users typically see genuine and large productivity gains. WRITER’s 2026 survey found individual gains of five times on specific tasks for heavy users. GitHub research on Copilot regularly reports 40 to 55 percent more code produced per week. These numbers are real.
Enterprise productivity is a different thing. It is the aggregate output the whole organisation produces, and it depends on more than the sum of individual productivity gains. If individual gains are absorbed as slack, enterprise productivity does not change. If individual gains produce more output but the output is not valued (because the market did not need more of it), enterprise productivity does not change. If individual gains create downstream bottlenecks in the workflow, enterprise productivity can actually decrease.
The 88 percent of CEOs in PwC’s 2026 survey who could not claim both revenue and cost wins from their AI investments are living this gap. They can see the individual productivity data. They cannot see the enterprise productivity data, because the transition mechanisms did not exist to convert the former into the latter.
Better productivity metrics for AI
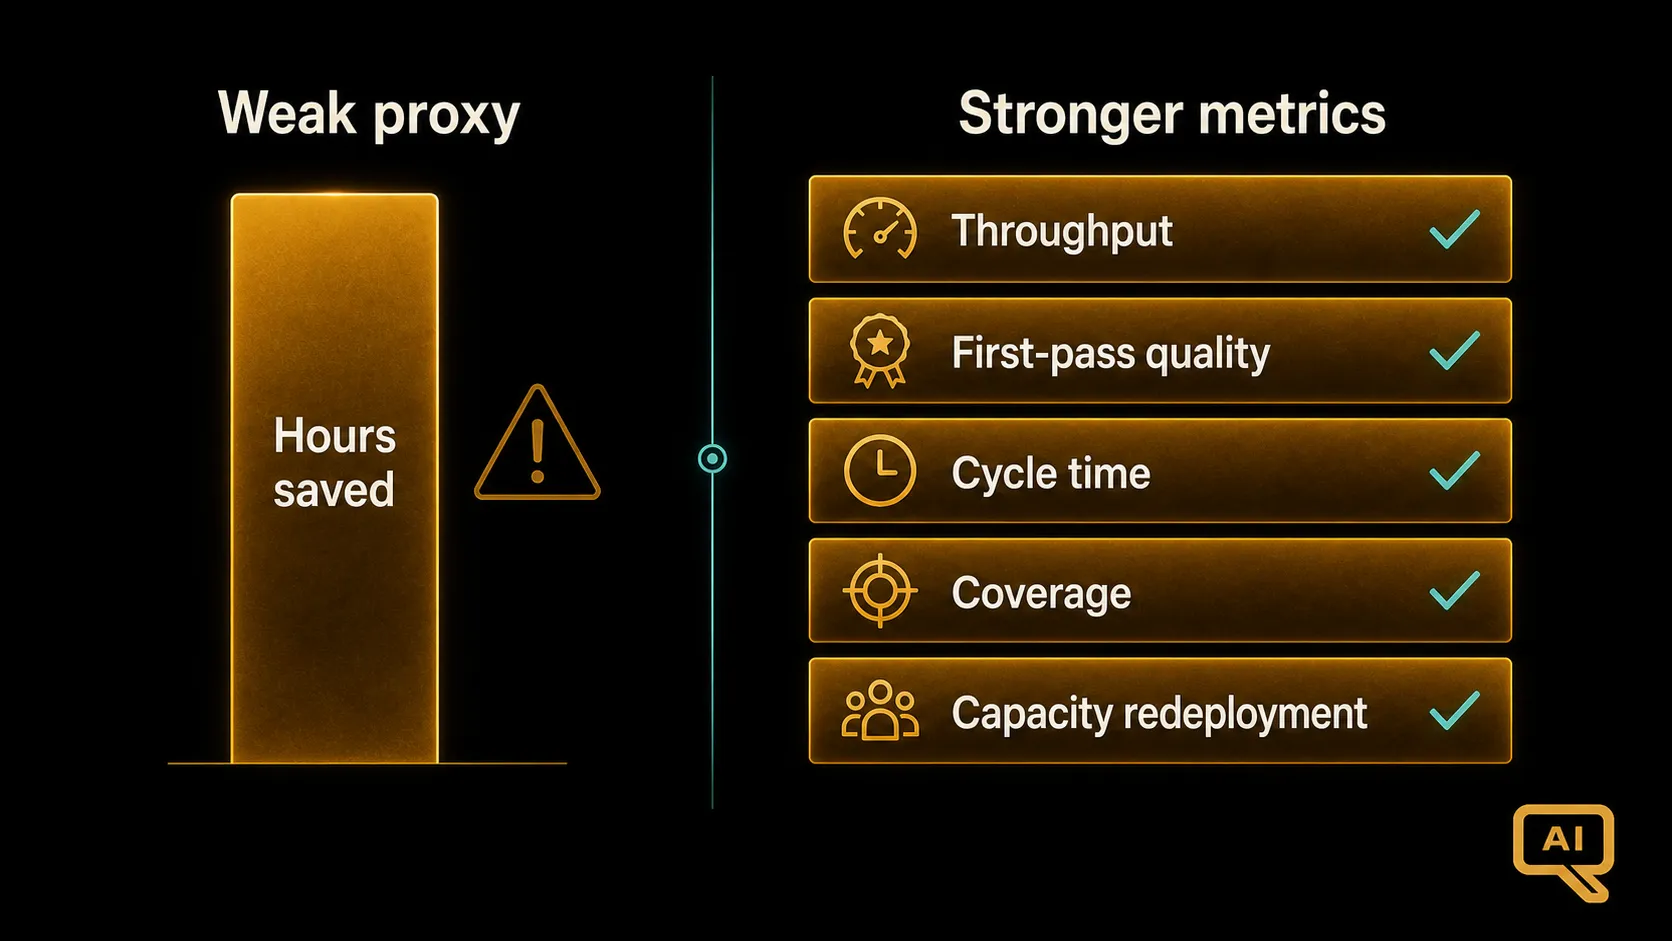
Figure 1 shows the metrics that hold up better than “hours saved” when finance is scrutinising the case.
Throughput, the first alternative in Figure 1, measures the volume of work units the team produces per unit time. Tickets resolved per week. Deals closed per month. Reports published per quarter. Throughput has the advantage of being directly observable and hard to game (either the volume happened or it did not). The disadvantage is that throughput without quality control is dangerous.
First-pass quality measures the fraction of work that is right the first time. Cases closed without reopen. Documents accepted without rework. Code merged without post-review changes. First-pass quality is one of the most underrated AI productivity metrics because it captures a real dimension of value (avoided rework cost) that “hours saved” completely misses.
Cycle time measures how long a work unit takes to complete end to end. Not the time on task, which is what “hours saved” captures, but the elapsed time from initiation to completion. This includes waiting time, handoffs, and rework, and it is often the metric customers actually experience.
Coverage measures the fraction of work the team is able to address relative to what could be addressed. If you used to close 60 percent of incoming tickets same-day and now close 85 percent, that is coverage improvement. Coverage is particularly good for support and operations use cases where demand exceeds capacity.
Capacity redeployment measures how much saved capacity actually got used on higher-value work, with specific attribution to the work that was done. This is the metric that closes the loop on the redeployment question, and it is the hardest to instrument because it requires tracking not just what got faster but what got done with the newly available time.
The “hours saved” survey is the worst possible input
If your business case relies on a survey where employees self-report hours saved, it is going to overstate value by a factor I typically peg at two to three times, sometimes more.
Self-reports have all the standard survey biases plus a specific one relevant to AI: employees know their leadership wants the tool to look good, and they respond accordingly. The numbers get inflated by expectation-setting and social pressure. This is not a moral failing; it is a well-documented effect in every kind of workplace productivity survey.
The alternative is objective measurement of the metrics above. That requires instrumentation, which requires baselines, which requires planning ahead. But it produces defensible numbers, which is the whole point.
The disordered eating pattern I want to name
There is a subtle failure mode in enterprise productivity measurement that I want to be direct about. When leadership pressure is heavy on “prove ROI,” teams start hunting for numbers that make the case look good. Hours saved surveys get run because they produce large numbers. Cost per token gets celebrated as savings when actual outcome economics may be worse. Adoption rate gets reported as productivity because it is easier to measure.
This is not measurement. It is theatre. And when the P&L eventually fails to catch up, the theatre collapses and the credibility of the whole programme goes with it. The 42 percent of companies that S&P Global reported abandoned most of their AI initiatives in 2025 include a large share of programmes that had glowing productivity metrics right up until the plug got pulled.
The discipline that avoids this is to measure the harder metrics from the start, accept that the numbers will be smaller than the theatrical version, and build the credibility with finance that comes from numbers that hold up.
Time savings that actually convert
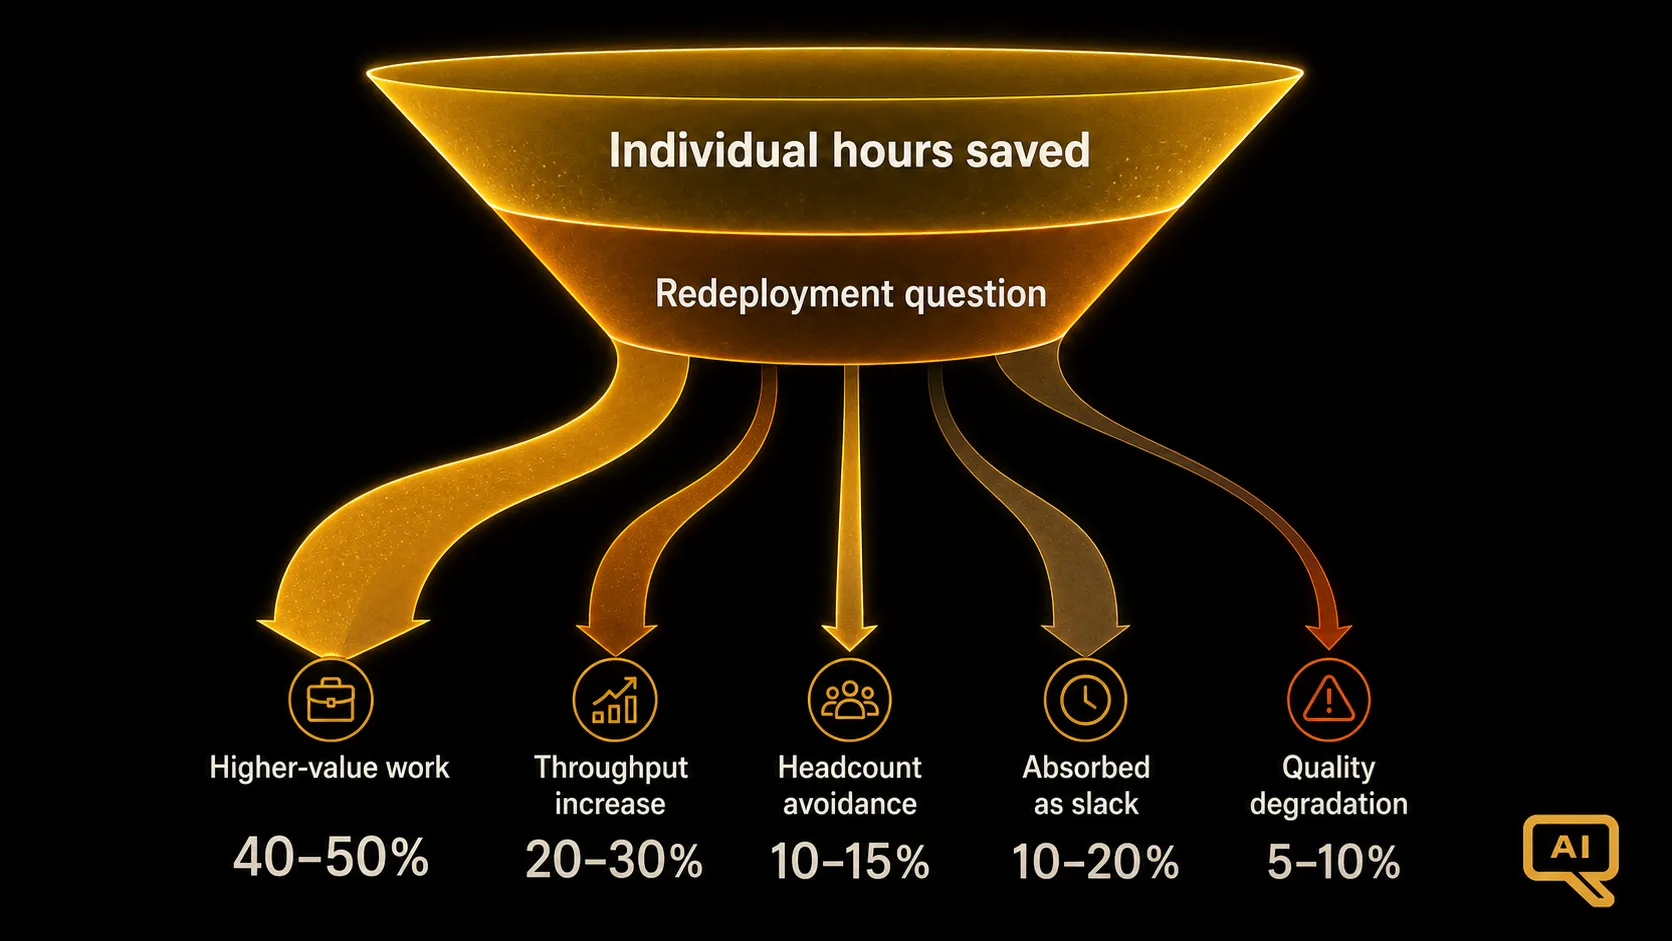
Figure 2 shows the funnel from individual hours saved to enterprise value realised. The critical middle stage in Figure 2 is the redeployment question. Programmes that instrument only the top of the funnel (hours saved) will overstate. Programmes that instrument the full funnel will produce smaller numbers but honest ones.
The organisations that manage this transition well share a common characteristic: they design the workflow change around the AI tool from the start. They know in advance what the saved capacity will be redeployed to. They have a manager accountable for making that redeployment happen. They measure not just the individual task savings but the eventual work output.
This is why the WRITER 2026 finding matters so much: the difference between the 29 percent who saw significant ROI and the rest was not the tool. It was the deliberate architecture of workflow change around the tool, with executive owners, defined KPIs, and priority use cases. Individual productivity is the raw material. The workflow architecture is what turns raw material into value.
If your business case has a hours-saved number in it, replace it with a redeployment story. What specific work will the saved capacity go into? Who is accountable for that redeployment happening? What will you measure to know it did? Answer those questions honestly and the productivity number gets smaller but the case gets stronger, because the case now describes something that can actually happen rather than something that sounds like it should.