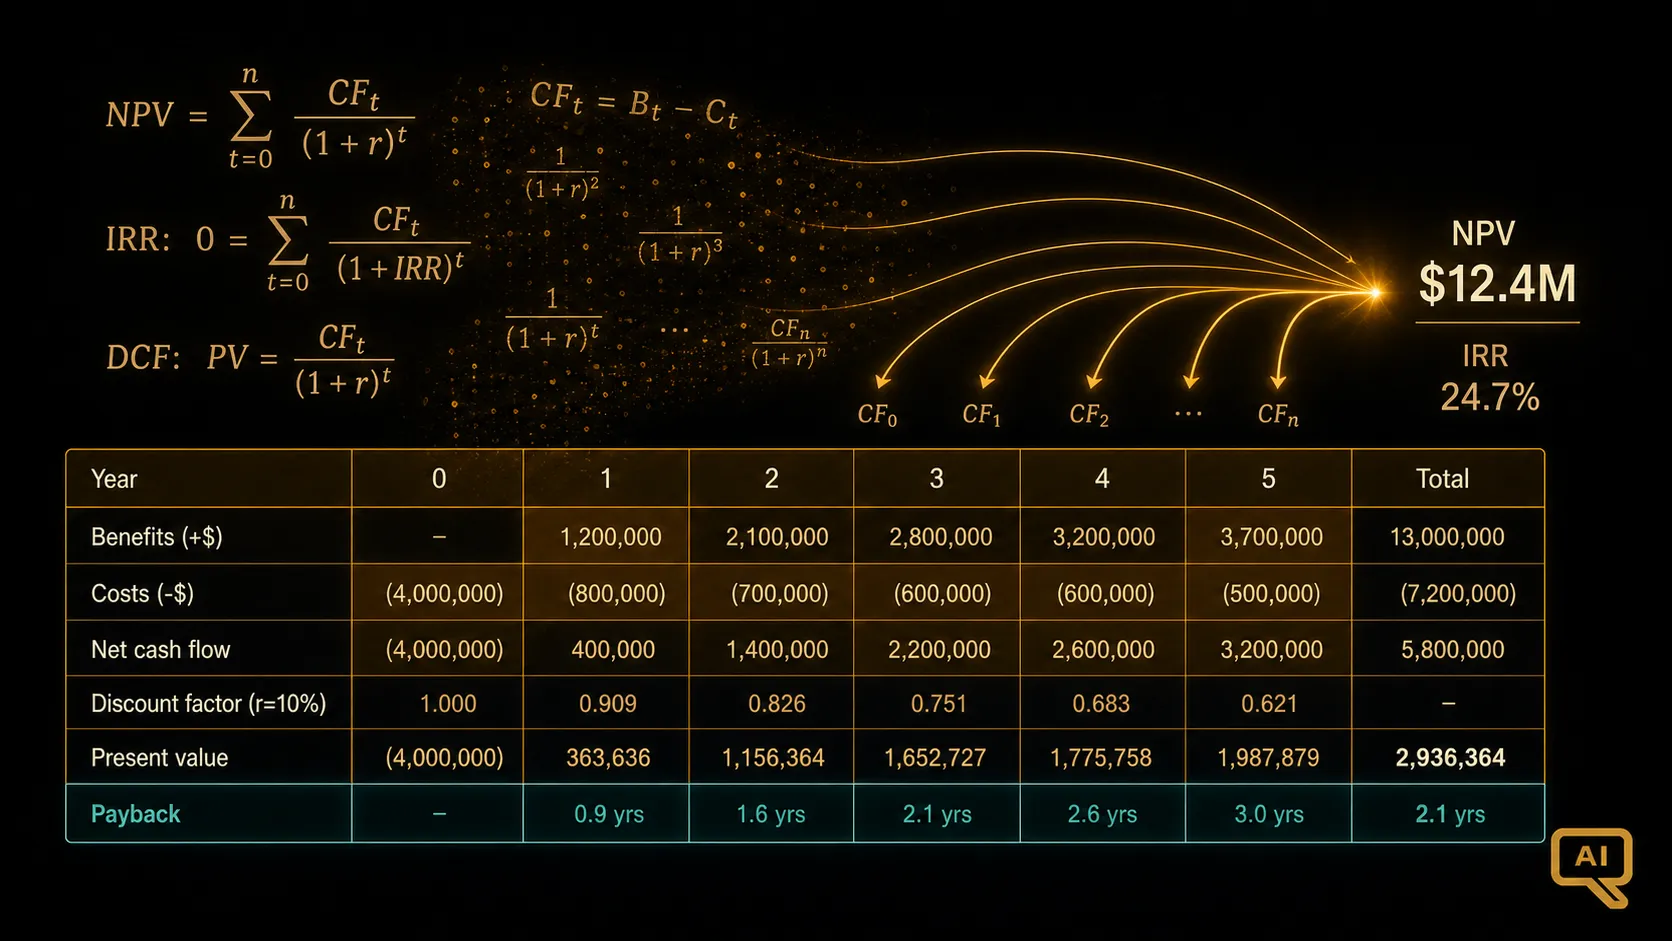
At some point in an AI business case, finance is going to want a spreadsheet. Not a slide, not a narrative, a spreadsheet. It will have discounted cash flows, a payback calculation, an internal rate of return, and a sensitivity analysis. It will be judged against a hurdle rate and compared with other investments competing for the same capital. If the numbers do not stand up, the project does not get funded, and no amount of strategic narrative will change that.
The good news is that AI investments can be modelled in a finance-grade way. The bad news is that most of the models I see are either too simple to defend or too speculative to trust. This article is about what a defensible AI financial model actually looks like, why it takes a bit more care than standard IT ROI modelling, and where the modelling stops being useful and needs to be complemented by other techniques (which is what BCR-08 picks up).
The three financial questions finance actually asks
Reduced to essentials, finance wants three answers. Is the investment worth doing (NPV positive at the discount rate). What is the return relative to alternatives (IRR versus hurdle). How long until we get our money back (payback period, undiscounted and discounted).
Everything else in the model exists to support those three answers. The sensitivity analysis exists so finance can see how robust the answers are. The scenario analysis exists so they can understand the range. The assumption toggles exist so they can trace where a number came from.
Modelling AI investments is not fundamentally different from modelling any other capital investment. The subtleties are in the assumptions, and specifically in how you handle the higher variance and the longer time-to-value that AI investments typically have.
Cash flow modelling for AI investments
The starting point is a clean, honest, year-by-year projection of cash flows. Costs on one line, benefits on another, net cash flow at the bottom. Nothing complicated in the structure. The difficulty is entirely in the inputs.
On the cost side, you use the TCO model from BCR-05, phased across the years. Year one is heavy with build costs. Years two through five reflect steady-state run rate plus periodic refresh costs.
On the benefit side, you need to be much more careful. The rule I use is: only claim benefits you can plausibly instrument and defend. If your value hypothesis includes revenue growth but you cannot describe how you would prove the AI caused the growth, do not put it in the base case. Put it in the upside case instead, and let finance decide how much of it to underwrite.
The benefit timing matters more than most people realise. If you assume value starts landing in month three but the adoption curve in your rollout plan suggests month nine, your NPV will be materially wrong. Time-to-value is one of the highest-leverage assumptions in the whole model, and it is one of the most commonly overstated.
Choosing a discount rate for AI investments
The discount rate is the rate at which future cash flows get pulled back to present value. Higher rate, more punishment for benefits landing later. The choice of rate is where a lot of AI business cases get in trouble.
Standard corporate practice is to use the weighted average cost of capital (WACC) as the base, with adjustments for project risk. WACC in most large enterprises is somewhere between 8 and 12 percent in current conditions. IT projects with well-understood outcomes often use a rate close to WACC. Higher-risk projects use higher rates.
AI projects, especially generative AI projects, sit in the higher-risk bucket for good reasons: outcomes are more uncertain, the technology is evolving fast, competitive dynamics can change abruptly, and regulatory constraints are unsettled. Depending on your organisation’s convention, an AI-specific discount rate of 15 to 25 percent is not unreasonable, and I have seen 30 percent used in early-stage exploratory investments.
The trap is that using a very high discount rate can kill projects that would actually deliver value, because their benefits are pushed too far into the future by the discounting. That is one of the reasons real options thinking (BCR-08) exists as a complement to standard NPV: when uncertainty is high, the value of flexibility and staged investment gets systematically underweighted by pure DCF.
Payback expectations for AI investments
Payback period is the simplest metric finance uses, and often the one that gets the most weight in gut-level decisions. It answers: how long until cumulative cash flow crosses zero?
For a well-scoped AI investment, realistic payback in 2026 is typically 12 to 24 months. Forrester’s data shows that 44 percent of AI projects that reach production achieve positive ROI within 12 months. The vendor benchmarks (IBM’s 6-month payback on WRITER deployments, or the 5.8x ROI within 14 months from McKinsey’s survey) reflect high-performing cases, not median outcomes.
If your model shows payback under 6 months, be suspicious. That is either a very well-targeted use case or an overstated benefit assumption. If your model shows payback over 36 months, be equally suspicious. That is either a very slow-burn strategic bet (where NPV is doing more work than payback anyway) or an under-instrumented value case.
The undiscounted payback is what most people quote. The discounted payback (which counts each future dollar at its present value) is a better measure of true payback, and for AI investments with higher discount rates it will be materially longer than the undiscounted version. Show both.
Sensitivity analysis: where the model actually earns its keep
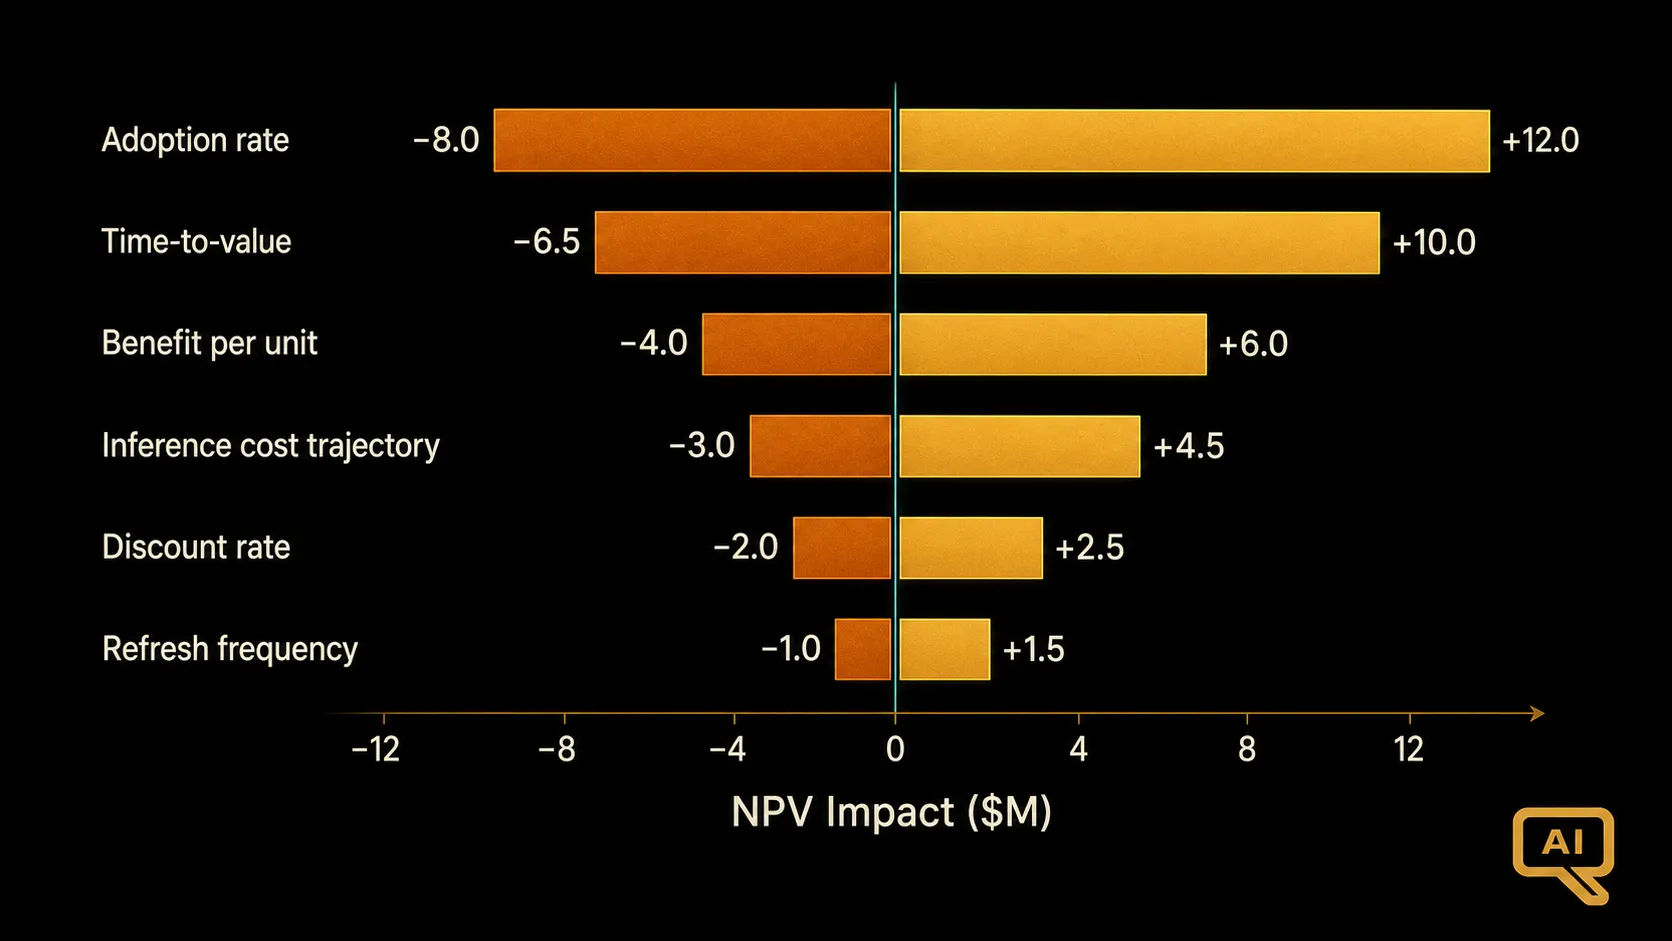
Figure 1 shows the sensitivity chart I include in every AI financial model. It is a tornado plot: each bar shows the impact on NPV of varying one assumption across its plausible range, holding everything else constant.
For AI investments the tornado almost always shows the same top variables: adoption rate, time-to-value, benefit per unit, and (for hosted deployments) inference cost trajectory. If your NPV is highly sensitive to any of these, you have material risk exposure that finance needs to see.
The reason sensitivity matters more for AI than for traditional IT is that the inputs are genuinely more uncertain. A CRM implementation has fairly well-established benchmarks for adoption rate and time-to-value. An AI copilot deployment has much wider ranges, and pretending otherwise sets up the model to be wrong.
The two longest bars in Figure 1 are almost always adoption and time-to-value, which is why those two variables deserve the most attention in the assumption chain. The right way to present sensitivity is not just as a plot but as a set of specific scenarios: what if adoption is 30 percent instead of 60 percent, what if benefits arrive in month nine instead of month three, what if inference costs increase 20 percent per year instead of decreasing. Each scenario should show the resulting NPV, IRR, and payback. This gives finance the material they need to underwrite the investment with eyes open.
Monte Carlo simulation for higher-stakes decisions
For AI investments large enough to matter to the enterprise (typically anything over a few million dollars or with strategic implications), a single-point sensitivity analysis often is not enough. Monte Carlo simulation lets you assign probability distributions to each key input and see the resulting distribution of NPV outcomes.
The output is a probability distribution: the median NPV, the tenth and ninetieth percentiles, the probability of the NPV being negative, and the probability of the payback being longer than a given threshold. This is a much richer picture than a single number, and for uncertain investments it can genuinely change the decision.
Monte Carlo is not standard practice in most enterprises for IT investments, and it should not be for every AI investment either. But for the larger and more uncertain bets, it is a technique worth reaching for, and the tooling to run it is now widely available.
The finance-grade model structure
Structurally, a defensible AI financial model has four tabs. Assumptions, where every input lives with a source and a range. Cash flows, where the assumptions feed into year-by-year projections. Summary, where the NPV, IRR, and payback are computed. Sensitivity and scenarios, where the analysis lives.
Assumptions should be colour-coded (blue for inputs, black for calculations, green for references) so any reader can trace where a number came from. Every material assumption should have a source noted (internal benchmark, vendor claim, industry study, expert judgment) and a confidence level.
Cash flows should be monthly for the first year and annual thereafter for a five-year model. Monthly granularity in year one lets finance see the ramp and validate the timing assumptions. Annual granularity beyond year one is enough for the NPV math.
The summary tab should be readable on a single screen and should include the three headline metrics, a chart of cumulative cash flow, and a quick-reference for the key sensitivity outputs. If a finance leader cannot get the story in 30 seconds from the summary tab, the tab needs work.
What NPV cannot tell you
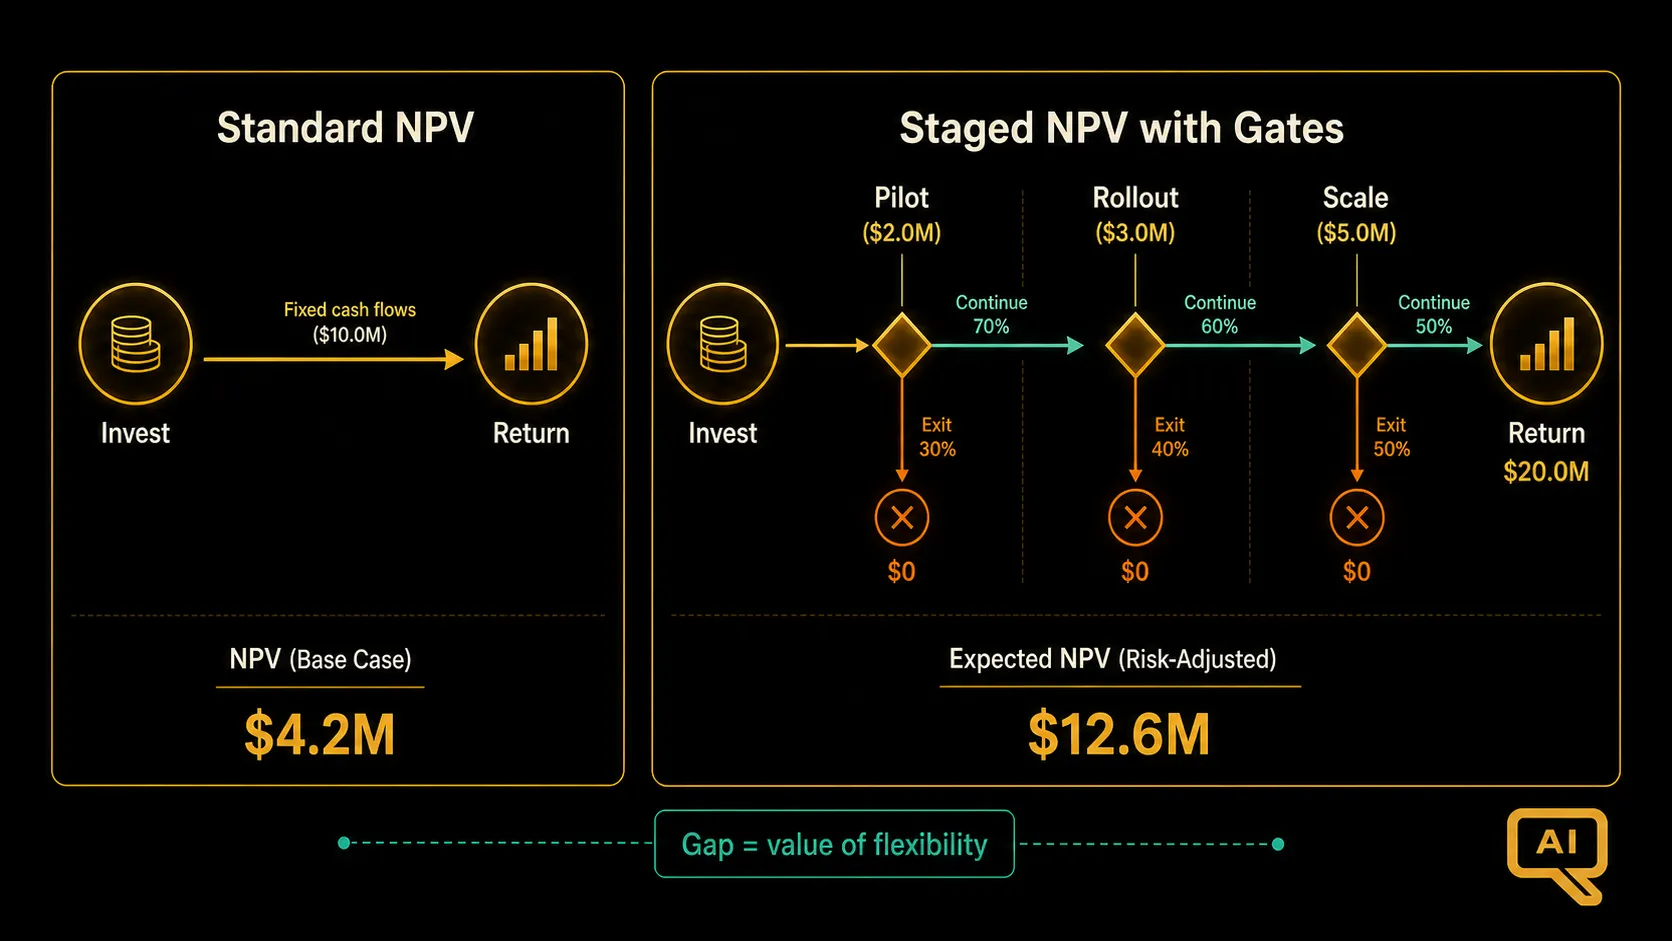
Figure 2 illustrates one of the important limitations of standard NPV for AI investments. NPV assumes a single deterministic path from investment to return. AI investments are almost always staged, with decisions to be made at each stage based on what was learned in the previous one.
Standard NPV underweights the value of that flexibility. It also underweights the value of learning: the fact that a pilot might return zero cash but produce information worth continuing to invest. And it tends to underweight the value of options that only become valuable if certain conditions hold (competitors adopt a technology, a use case scales past a threshold, a regulation opens or closes a market).
The gap between the two curves in Figure 2 is the value of flexibility, and standard NPV puts a zero on it by default. This is why NPV is a necessary but not sufficient tool for AI investment decisions. BCR-08 picks up where this article stops and covers real options thinking, which is the framework for handling those staged and optional dynamics properly.
Presenting the model
The last practical point: how you present the model matters as much as what is in it. Finance leaders read hundreds of business cases. The ones that stand out are the ones that are clear about what is known versus assumed, honest about sensitivity, and structured around the specific decision the reader is being asked to make.
A model that opens with the NPV and the three biggest risks that could change it, then walks the reader through the logic, then shows the sensitivity, tends to get read seriously. A model that opens with the strategic rationale, buries the numbers, and hides the sensitivity in a hidden tab tends to get skimmed.
I cover the presentation dimension more fully in BCR-16, which is specifically about presenting to the CFO and the board. For now, the point is that the financial model is a tool for making a decision, not a document for justifying a decision that has already been made. Build it that way and finance will treat it that way.