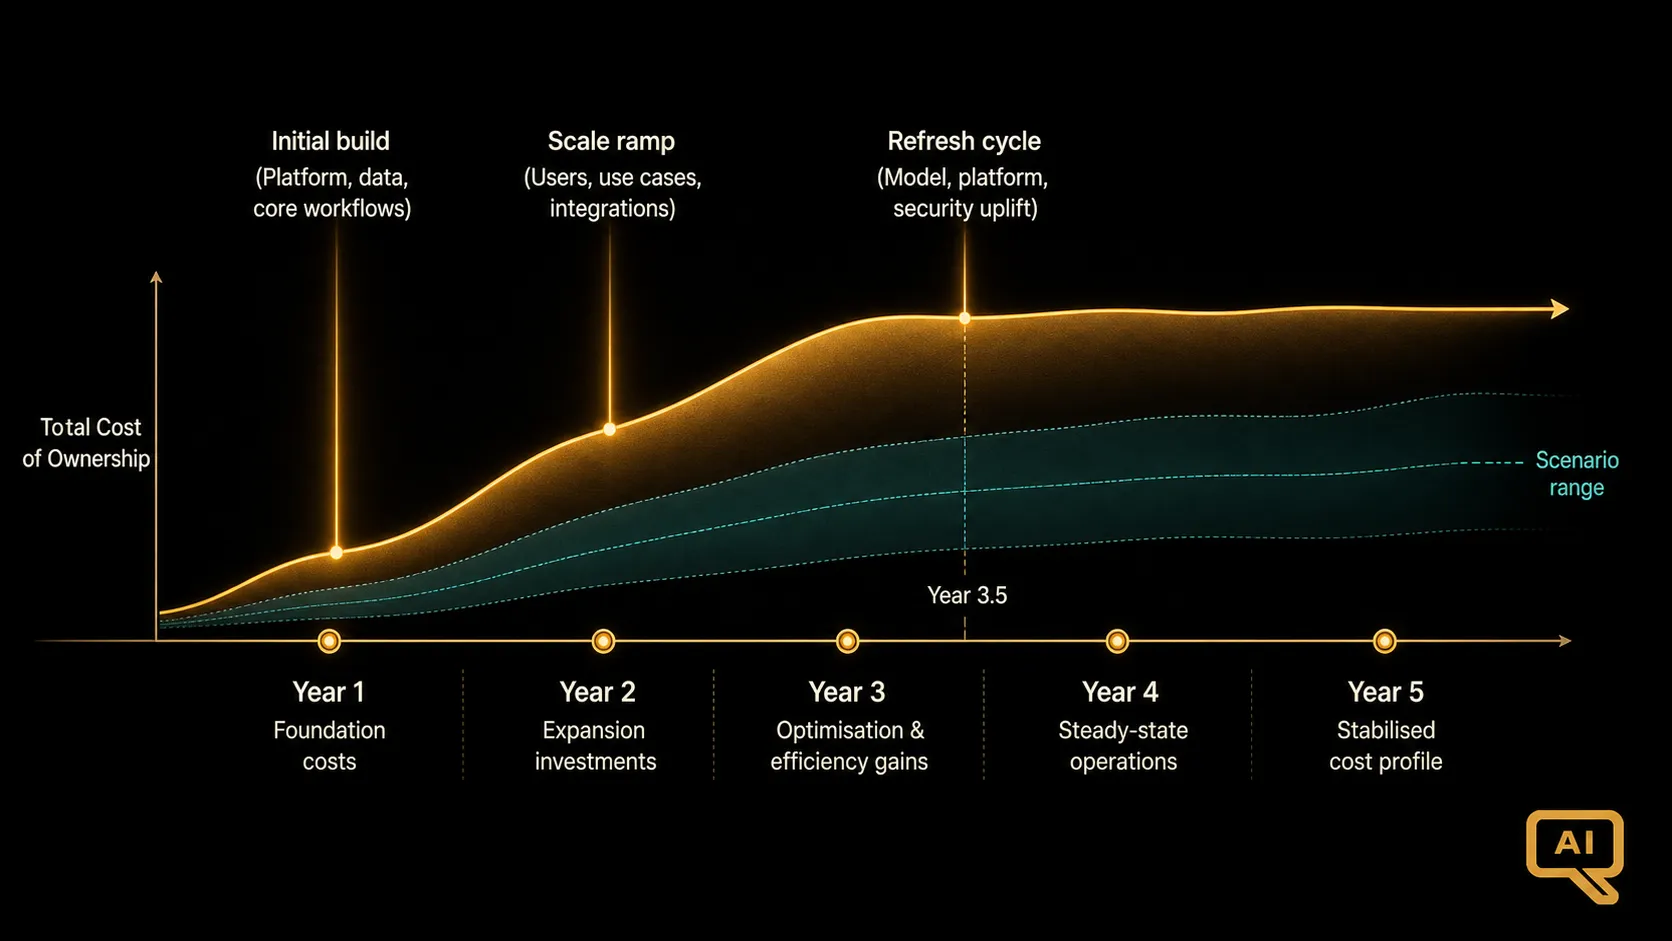
If BCR-04 was about seeing the full cost stack, this article is about turning that stack into something finance can underwrite: a five-year total cost of ownership model that stands up to scrutiny. TCO is the workhorse of enterprise investment decisions for a reason. It forces you to think in the same units as the value hypothesis, over the same period, with the same discipline.
The trap is that TCO models for AI systems inherit a lot of assumptions from traditional software TCO, and most of those assumptions do not hold. AI costs are more volatile, more usage-linked, and more subject to platform shifts than any category of enterprise software I have worked with. Building a defensible TCO model means being explicit about which assumptions you are making and where the ranges are.
The five-year frame
Why five years? Two reasons. First, most enterprise capital planning cycles work in three-to-five-year windows, so a TCO shorter than that will not connect with the way finance thinks about return. Second, the interesting cost dynamics of AI systems (scaling with adoption, model refresh cycles, workflow amortisation) only become visible over multiple years.
The counter-argument I sometimes hear is that AI is changing too fast to project five years out. That is fair; my response is that you build the model with explicit assumption toggles, and you commit to updating it every six months as reality intrudes. The five-year frame is not a prediction. It is a structure for reasoning about what has to be true for the investment to make sense.
The seven cost categories
I break AI TCO into seven categories. The categories are consistent across deployment types, but the mix within each shifts significantly depending on whether you are building on hosted models, self-hosting, going hybrid, or licensing packaged applications.
The first category is one-time build and setup. This includes initial data engineering, integration work, security review, initial evals, pilot infrastructure, and the change management design work. In year one this is often 40 to 60 percent of the total cost. In subsequent years it drops to near zero, though it reappears at each major refresh.
The second is ongoing inference. This is model API spend, or self-hosted GPU costs, or the compute portion of an on-prem deployment. In hosted models this line grows with usage; in self-hosted it grows in step changes as capacity is added. Between 2021 and 2025 the per-token cost of a given model capability dropped by roughly 10 times a year, but total inference spend continued to rise because usage grew faster than unit cost fell. Whether that pattern holds through 2027 is one of the biggest assumption toggles in any AI TCO model.
The third is the data pipeline. Sources, transformations, quality checks, PII handling, embeddings generation, indexing, and ongoing maintenance. This scales roughly with the number of data sources and the freshness requirements, not with user count. It is often underestimated by 2 to 3 times in first-draft models.
The fourth is the platform and MLOps team. Engineers, data scientists, ML engineers, SRE-equivalent roles for AI, and the management overhead. This is usually the largest single line item in enterprise deployments after year one, and it is where scale economics really matter. A ten-team organisation running one shared platform team is dramatically more cost-efficient than ten teams each running their own.
The fifth is the eval, monitoring, and reliability stack. Test infrastructure, benchmark maintenance, dashboards, alerting, on-call cost, incident response, and continuous improvement. Grows with the number of production use cases and the criticality of each.
The sixth is change management and enablement. Training, communications, adoption support, workflow redesign, community programmes. Highest in year one, moderate in year two, and steady-state thereafter. This is where the difference between the 5 percent high performers and everyone else usually shows up in the P&L.
The seventh is compliance, security, and governance. Reviews, audits, external certifications, legal counsel, regulatory reporting, risk management. Growing across the board as the regulatory environment matures.
The build-buy-hybrid crossover
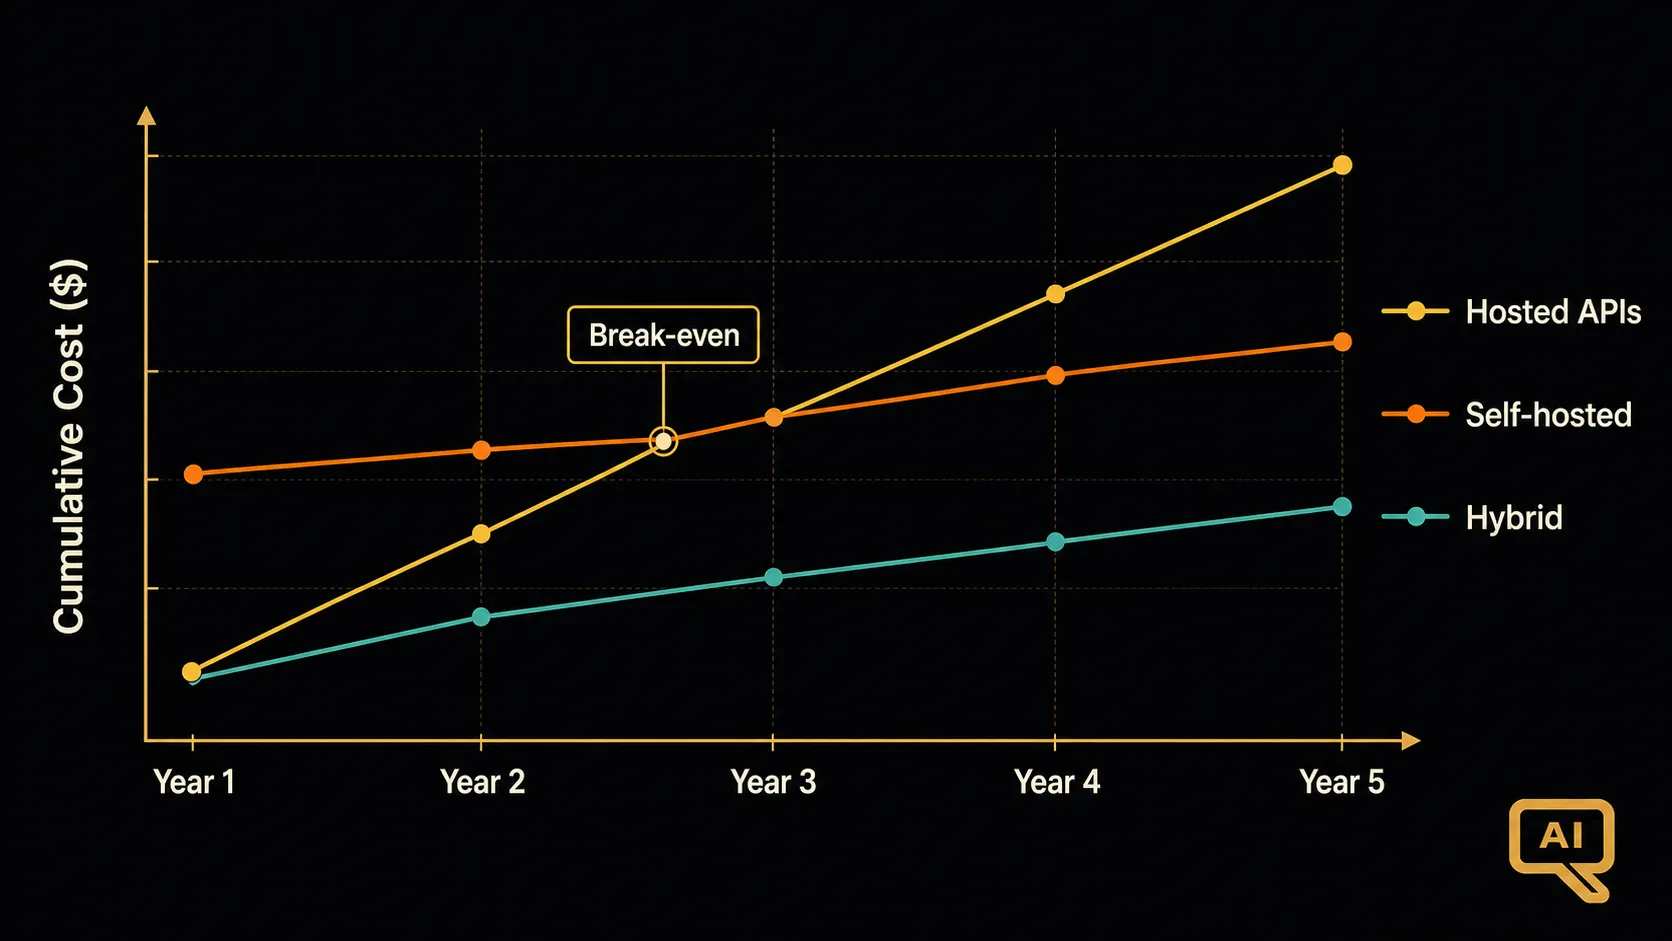
Figure 1 shows one of the most consequential comparisons in AI TCO: hosted versus self-hosted versus hybrid over a five-year window. The shapes are quite different.
Hosted APIs start low, scale linearly with usage, and stay usage-linked for the full period. They are the cheapest option at low volume and often at moderate volume too. They become expensive when usage scales past a threshold that depends on your prompt shapes and model tier.
Self-hosting starts high (GPU procurement or reservation, MLOps team hiring, initial engineering) and then scales more slowly with usage. There is usually a break-even point where cumulative self-hosted cost drops below cumulative hosted cost. In 2026 that break-even is typically somewhere between 5 million and 20 million tokens per day, depending on the specific model and workload shape, though it can be lower for specialised distilled models on efficient hardware.
Hybrid deployments (which are becoming more common in 2026) route traffic between hosted and self-hosted based on the specific request, using the cheapest capable option for each. Hybrid has the highest engineering complexity but often the best economics at scale. The routing logic itself has a cost that is easy to overlook.
The right answer depends on your usage profile, your security requirements, and your engineering capacity. Reading Figure 1 the wrong way is easy: assuming self-hosting is always cheaper because the line eventually crosses. The wrong answer is picking one without actually modelling the alternatives. I have seen large enterprises stay on hosted APIs long past the break-even point because nobody ran the numbers, and I have seen smaller organisations rush to self-host at scales where hosted would have been dramatically cheaper.
The volatility risk: what if inference prices reverse
One assumption that deserves special attention: what happens if inference prices stop falling, or reverse? The current pricing on hosted APIs is partly funded by venture capital and hyperscaler cross-subsidies. When capital discipline tightens, prices may normalise upward, and any TCO model built on 2025 pricing may look very different at 2027 pricing.
I run three scenarios in every TCO model I build. The base case assumes prices decline at 30 to 50 percent per year, which is slower than the 2021 to 2025 pace but still declining. The bear case assumes prices are flat from 2026 onward. The stress case assumes prices increase by 20 to 40 percent over the five-year window. The point is not to predict which one is right. The point is to see how sensitive your TCO is to the assumption, so you can plan for the range.
For hosted-heavy deployments, the sensitivity to inference price is enormous. For hybrid and self-hosted deployments, it is much smaller, which is one of the strategic arguments for building optionality into the deployment architecture even when hosted is currently cheaper.
The refresh cycle amortisation
Every major model release triggers a refresh cost: evals rerun, prompts updated, downstream systems revalidated, sometimes fine-tuning redone. The frontier models are currently releasing at roughly six-month cadence, though the pace of major shifts (those requiring meaningful application-level changes) is closer to twelve to eighteen months.
A defensible TCO model amortises the refresh cost as a recurring line item, not a one-off surprise. My rule of thumb is that annual refresh cost runs 10 to 25 percent of the year-one build cost, depending on how tightly coupled the application is to specific model behaviours. Loosely coupled deployments (well-abstracted model calls, comprehensive evals, clear separation between orchestration and model) refresh much cheaper than tightly coupled ones.
This is one of the areas where architectural decisions made early in the project have huge TCO implications later. Loose coupling costs more upfront and less every year after.
The redundancy multiplier for critical systems
For any AI system supporting critical business processes, you need a fallback. That means at minimum a warm secondary model provider, and often a fallback path that degrades gracefully to non-AI behaviour. Building and maintaining redundancy adds roughly 15 to 40 percent to steady-state costs, depending on how deep the redundancy goes.
The temptation is to skip this and hope. I have watched multiple organisations do exactly that and then get hit by a provider outage or a policy change that took a critical workflow offline. The redundancy cost is real, but the cost of not having it can be much higher, and it should be in the TCO model from day one for anything customer-facing or revenue-critical.
Putting the model together
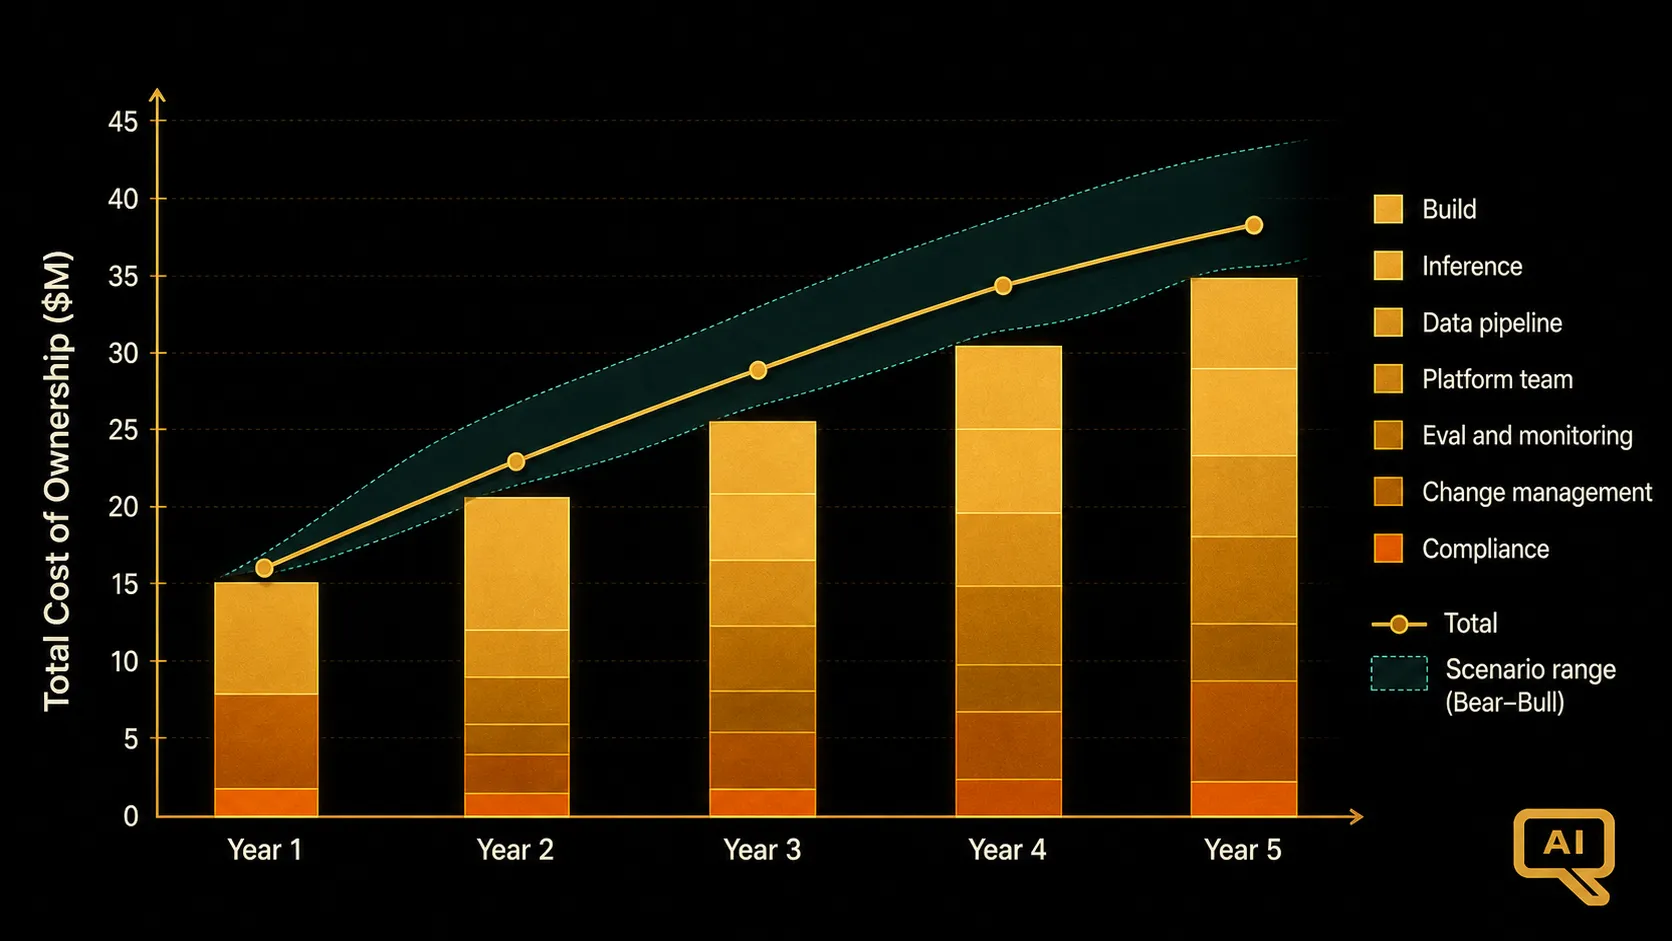
Figure 2 shows what a completed TCO model looks like when it is stacked out year by year. Year one is dominated by build costs and change management. Years two and three see inference and platform team costs grow while build costs drop. Years four and five stabilise if the deployment stays roughly the same shape, or they show a step change if new use cases are added or a major refresh cycle hits.
The scenario band in Figure 2 is the important part. It shows the range from your bear case to your bull case, driven by the assumption toggles: adoption rate, inference price trajectory, model refresh frequency, and usage growth. A tight band means the TCO is well-understood. A wide band means you have material uncertainty on one or more inputs, and you should be honest about that with finance.
The uncomfortable truth
Most first-draft TCO models produce numbers that are 40 to 100 percent higher than the initial cost estimates in the business case. That is not because AI is unusually expensive. It is because the initial estimates were only counting the visible layer.
When those numbers land in front of a project sponsor for the first time, the reaction is usually resistance. Nobody wants to go back to the CFO and say the number is bigger than they promised. My argument is always the same: better to know now than in month eighteen when the budget runs out and the project has to be shelved. A TCO that reflects reality gives you the foundation to make good decisions about scope, staging, and architecture. A TCO that hides the surround gives you a project that fails on schedule.
The next article, BCR-06, digs into one of the biggest lines in the TCO stack (inference economics) and the specific levers that can move it by an order of magnitude before scale becomes a problem.