
There is a moment in almost every AI strategy conversation where somebody says, “we’re actually quite advanced on AI,” and everybody in the room silently disagrees. I have been in that room. The claim usually rests on a handful of enthusiastic pilots, a ChatGPT Enterprise subscription, and one team’s impressive demo. Meanwhile the finance system still runs on spreadsheets emailed weekly, and nobody can say which customer table is the accurate one.
Self-assessment is hard because AI maturity is not one thing. An organisation can be genuinely advanced in one function and pre-industrial in another. It can have brilliant models and broken data, or pristine data and no idea what to do with it. Without a shared vocabulary for “where are we,” strategy conversations dissolve into anecdotes.
This article gives you that vocabulary: a five-stage AI maturity model, plus the dimensions to score yourself against and, most importantly, the discipline to score honestly. Interestingly, honest self-placement is getting rarer, not more common: the share of companies who believe their strategy is highly prepared for AI has risen to 42%, even as those same leaders report feeling less prepared on infrastructure, data, risk, and talent. Confidence is outrunning capability, and the gap between the two is where budgets go to die.
The five stages
Figure 1 lays out the five stages, and I will describe each one by how it actually feels from the inside, because that is how you will recognise yourself.
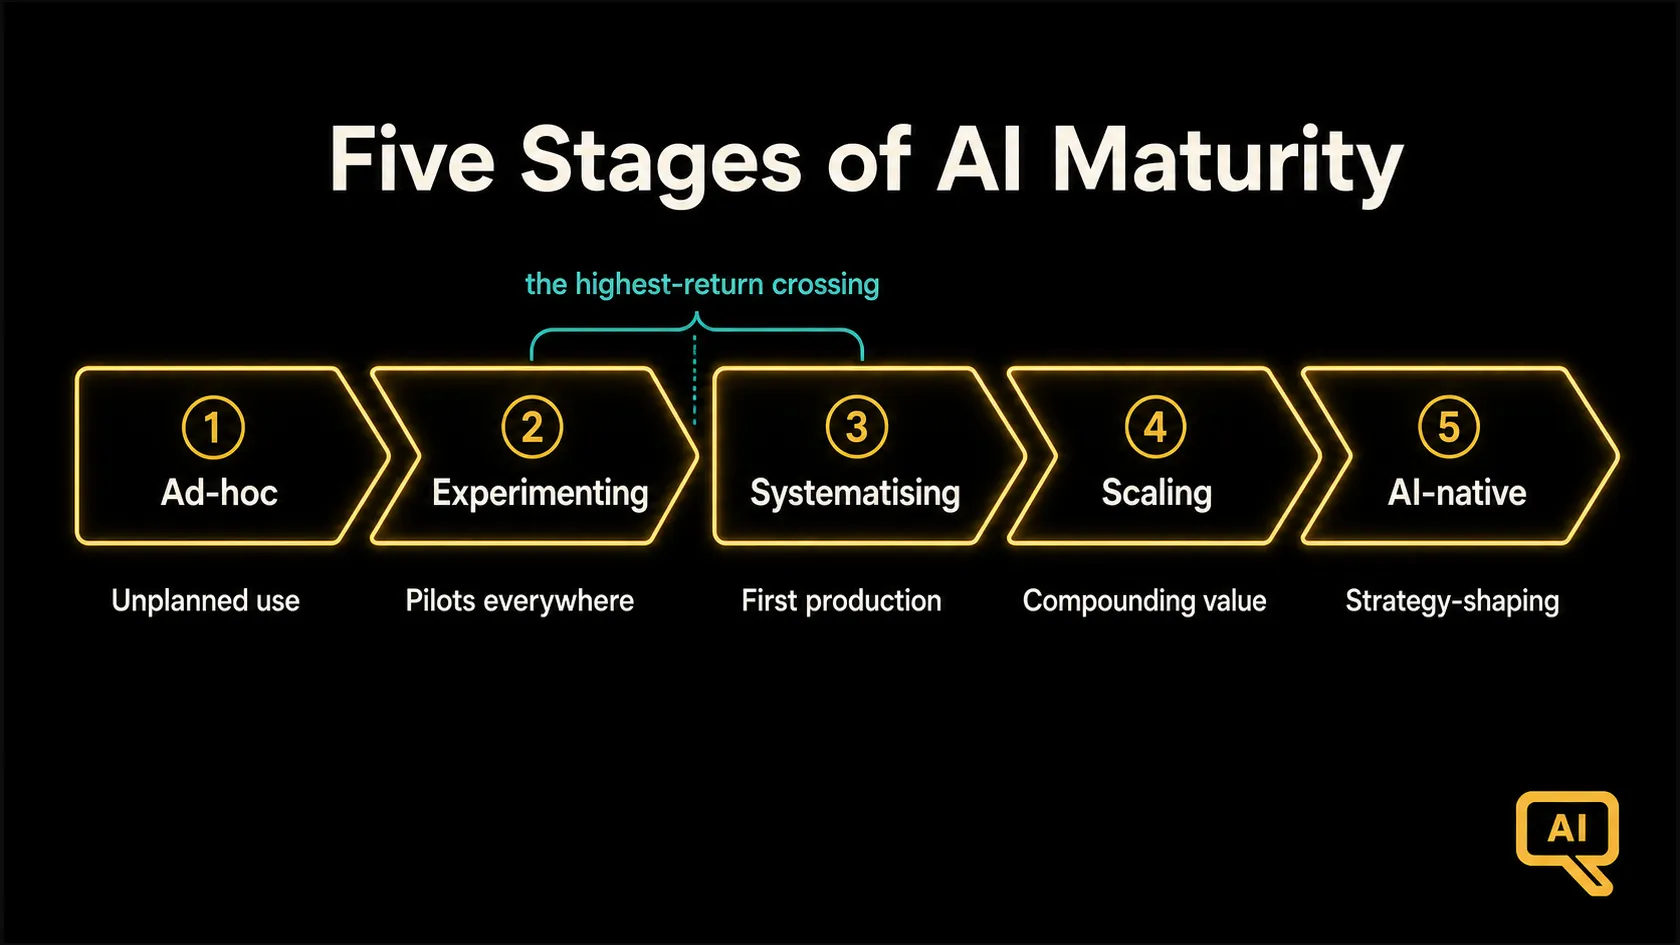
Stage 1: Ad-hoc
AI use exists but nobody planned it. Individuals use consumer tools, often unsanctioned. There is no inventory of what is in use, no policy worth the name, and no connection between AI activity and business outcomes. The organisation’s official position on AI is essentially whatever the last executive said at a town hall.
The tell: if I asked ten employees “what is our AI strategy,” I would get ten different answers, and at least three would be “we have one?”
Nothing about Stage 1 is shameful. Every organisation starts at the left edge of Figure 1. What is costly is staying here while believing you are somewhere else, because ad-hoc use without visibility is where shadow AI risk breeds.
Stage 2: Experimenting
Leadership has noticed. There are sanctioned pilots, maybe a tiger team, possibly a budget line. Energy is high; discipline is low. Pilots are selected by enthusiasm rather than value, success criteria are written after the fact if at all, and each pilot builds its own data plumbing from scratch.
The tell: you can name many experiments but no production systems with measured business impact. Demos outnumber deployments ten to one.
Stage 2 is useful, briefly. Its purpose is learning: what the technology can do, what your data can support, who your capable people are. Organisations that treat Stage 2 as a destination develop pilot sprawl, the pattern where twenty proofs-of-concept substitute for one production result. The industry data on this is brutal: only around 25% of AI initiatives deliver their expected ROI, and just 16% ever reach enterprise-wide scale. Most of that attrition is Stage 2 behaviour persisting into Stage 3 budgets.
Stage 3: Systematising
The turn. Somebody with authority decides that AI will be done deliberately: a prioritised use-case portfolio, shared platforms instead of per-team plumbing, written governance guardrails, and success metrics agreed before pilots start. The first real production deployments land, and they are measured.
The tell: you can point to at least one AI system in production, wired into a real workflow, with a before-and-after metric a CFO would accept.
Stage 3 is where the compounding starts, and it is also where the hard organisational work lives: data readiness programmes, ownership fights, the unglamorous evaluation infrastructure. Organisations that used systematic evaluation tools moved nearly six times more AI systems into production than those that did not. That is what systematising buys you.
Stage 4: Scaling
AI stops being a programme and starts being how several parts of the business run. Multiple production systems, shared data foundations feeding them, a functioning operating model (central platform, federated delivery, or a hybrid), and governance that operates as an enabling function rather than a gate. Agents begin taking real actions in bounded workflows, with oversight designed in.
The tell: new AI use cases ship in weeks, not quarters, because the foundations already exist. The marginal cost of the next use case keeps falling.
This is where the value concentrates. The distribution of AI returns is savagely unequal: roughly 74% of all AI-generated economic value flows to about 20% of organisations. That 20% is, almost by definition, the Stage 4 and Stage 5 population. They are not smarter. They did the Stage 3 work earlier.
Stage 5: AI-native
The rare end state, and for most organisations an orientation rather than an address. AI capability shapes strategy rather than serving it: products are designed around what models make possible, decision-making assumes AI in the loop, and the organisation redesigns roles and processes continuously as capability shifts. Very few organisations are genuinely here, and several who claim to be are Stage 3 with a good communications team.
I include Stage 5 not because you should target it next year, but because knowing the direction of travel changes today’s choices.
The six dimensions
A single stage number hides more than it reveals, because maturity is uneven. I score organisations across six dimensions, each rated 1 to 5 against the stage definitions:
Strategy and leadership. Is there a written strategy with named outcomes? Does leadership engage with substance or slogans?
Data. Can your priority use cases get accurate, permitted, accessible data today? (This dimension lags most often, and it caps everything else. Your effective maturity is rarely higher than your data maturity.)
Technology and platforms. Shared, secure paths to production, or per-team improvisation?
People and skills. Depth beyond the tiger team. Are business users capable, or dependent?
Governance and risk. Proportionate guardrails that people actually follow, or either anarchy or bureaucracy?
Value realisation. Are outcomes measured against baselines, and does anyone kill initiatives that miss?
Plotting the six scores gives you a shape, not a number, and the shape is the diagnostic. Figure 2 shows two real (anonymised) profiles that both average out to “Stage 2.5” while needing completely different strategies.
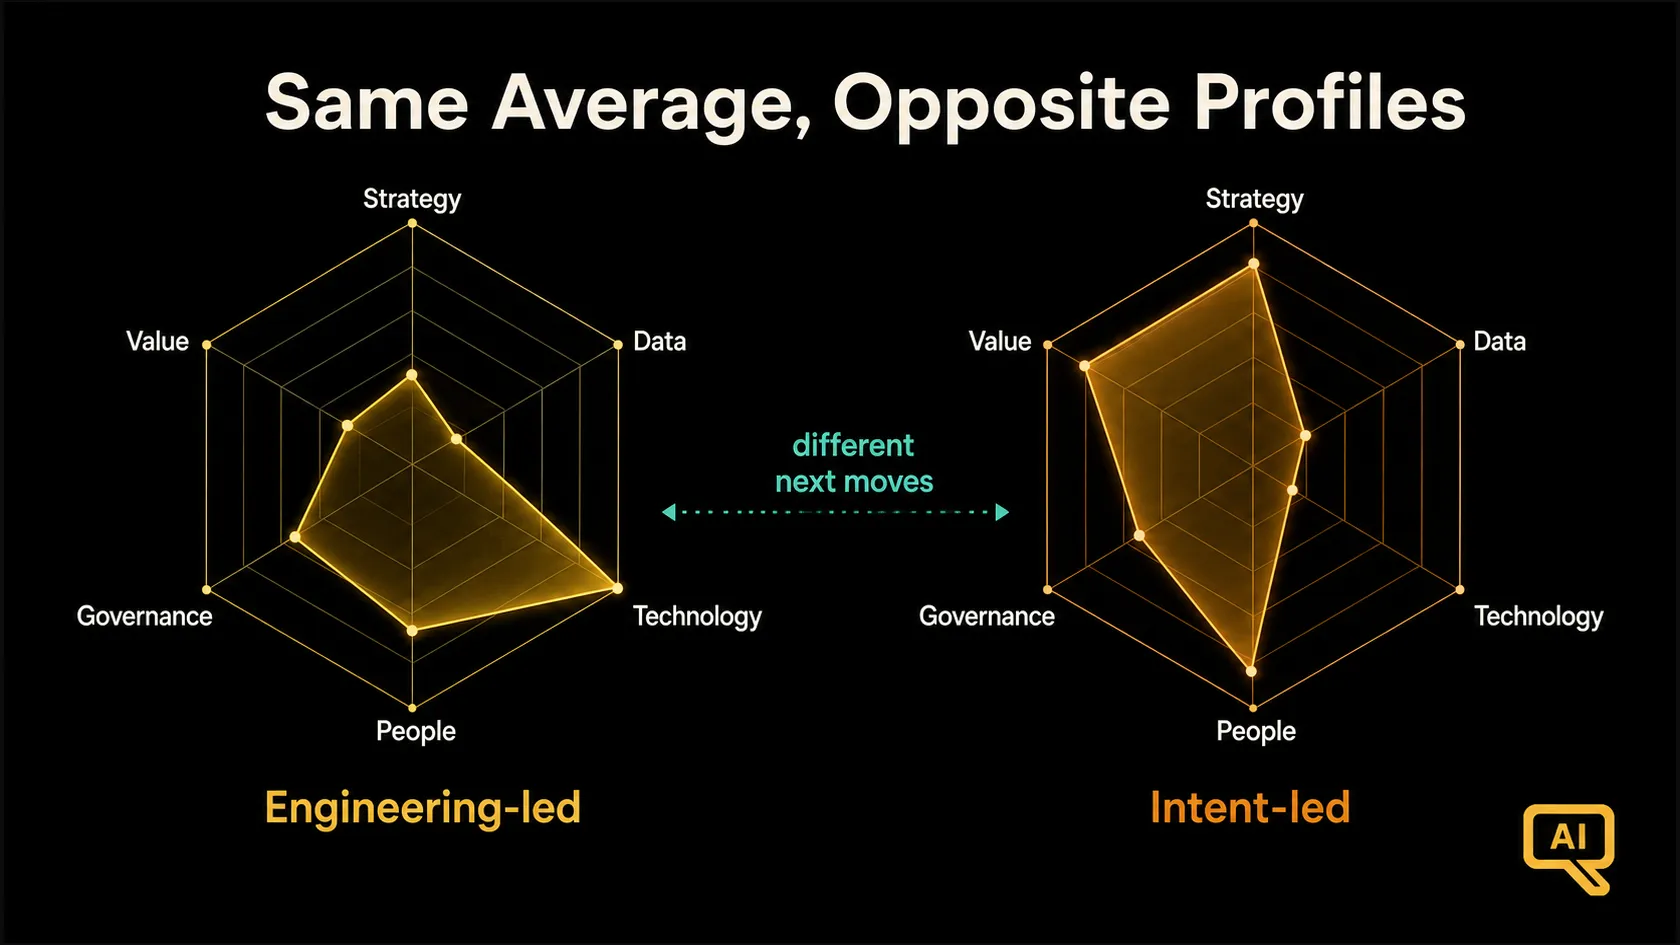
The first profile in Figure 2 is technology-heavy and value-light: strong platforms, weak measurement, a classic engineering-led programme. Its next move is not more technology; it is Boxes 1 and 3 of the strategy canvas, forcing value discipline onto existing capability. The second profile is the mirror image: strong leadership intent, weak data and platforms. Its next move is foundational investment, and its leaders need to hear that the exciting use cases must wait a quarter or two. Same average, opposite prescriptions. This is why I distrust maturity scores presented as a single number.
How to score honestly
The model only works if the scoring is honest, and honesty needs process, not virtue. Four rules.
Score by evidence, not intention. A policy counts when it is followed, not when it is drafted. A production system counts when a business metric moved. If the evidence for a score is a plan, score the stage below.
Score the median, not the highlight. Your most advanced team is not your maturity; your typical team is. One brilliant pocket plus organisational indifference is Stage 2 with good PR.
Triangulate. Have three groups score independently: leadership, delivery teams, and the business functions AI is meant to serve. The gaps between their scores are usually more informative than the scores themselves. When leadership scores two points above delivery, you have found your real problem, and it is not technical.
Re-score on a cadence. Maturity assessment is a compass, not a trophy. Twice a year is right for most organisations. The interesting question is never “what is our score” but “what moved, and did the things we invested in move it?”
Using the result
Your maturity profile feeds directly back into the strategy canvas. It calibrates Box 2 (priority use cases should sit at or just above your maturity, not three stages beyond it), exposes Box 4 and Box 5 gaps with numbers attached, and disciplines Box 9 sequencing: foundation work first where the profile is lopsided.
It also sets expectations honestly with leadership, which might be its highest value. A Stage 2 organisation promising Stage 4 outcomes inside a year is writing cheques its data cannot cash. The maturity conversation, done early, converts that future disappointment into a present plan.
One last encouragement. The distance from Stage 2 to Stage 3 feels bureaucratic while you are crossing it: portfolios, ownership, evaluation, plumbing. It is also the single highest-return crossing in the entire model, because it is where the 12x production differential and the 6x evaluation differential live. The organisations capturing outsized value in 2026 are not the ones with secret models. They are the ones that crossed that bridge while their competitors were still enjoying the demos.
Next in the track: the dimension that caps all the others. Data readiness, and how to assess whether your data can actually support the strategy you just wrote.