
Years ago, the Business Model Canvas did something quietly radical: it took the sprawling, hundred-page business plan and compressed it onto a single sheet that a leadership team could actually argue about. The compression was the point. When everything has to fit on one page, you cannot hide vagueness behind volume.
AI strategy needs the same treatment, maybe more urgently. AI strategy documents have a way of ballooning: market context, technology primers, vendor comparisons, risk registers. All useful, none of it strategy. The strategy is the set of choices, and choices fit on a page.
So this article gives you the AI Strategy Canvas: a one-page framework with nine boxes that together force out the choices that matter. I designed it to be filled in during a working session, argued over, and revised quarterly. It is the signature tool of this track, and every later article deepens one or more of its boxes.
Why a canvas, and why now
The case for compression got stronger in 2026 for a practical reason: the field moves too fast for heavyweight strategy documents. By the time a fifty-page strategy has been drafted, socialised, and approved, two model generations have shipped and a new regulation has landed. A canvas can be updated in an afternoon. A tome cannot.
There is also a research-backed reason to formalise at all. Organisations with a formal AI strategy report success rates in AI adoption around 80%, against roughly 37% for those without one. The gap is not because the document is magic. It is because writing the choices down forces alignment, and alignment is what lets an organisation concentrate force instead of scattering pilots everywhere.
The canvas gives you the formality without the weight.
The nine boxes
Figure 1 shows the full canvas layout, and I will walk through each box in the order I recommend filling them.
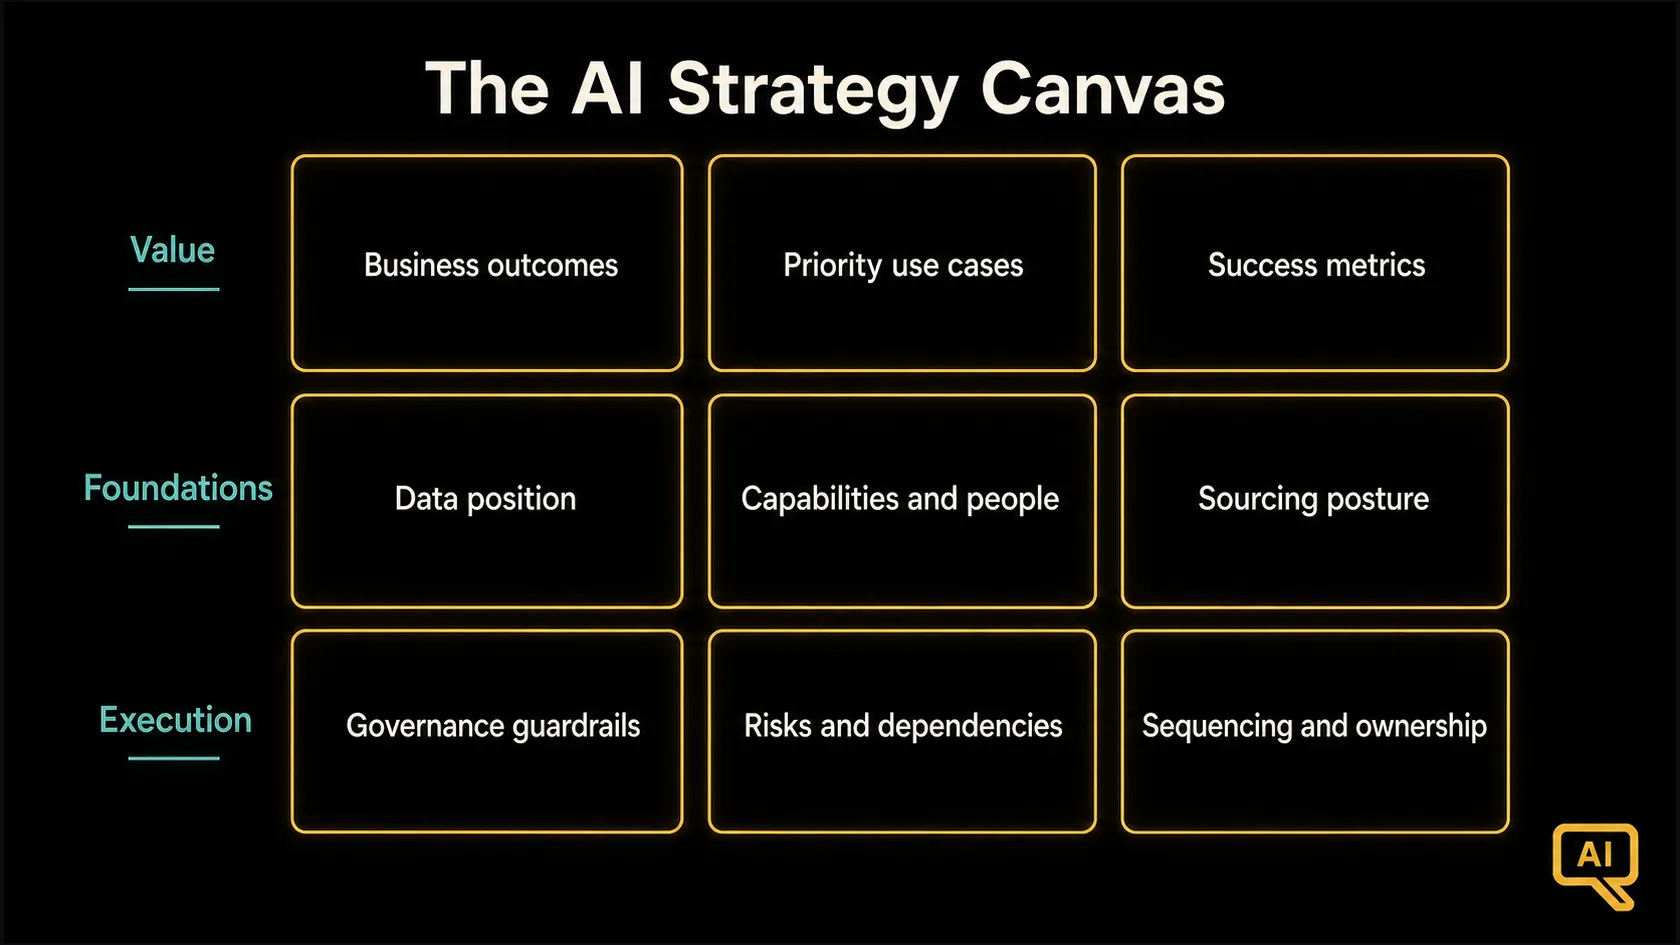
As Figure 1 makes visible, the canvas is organised into three bands. The top band is about value: why AI, where, and how you will know it worked. The middle band is about foundations: data, capabilities, and sourcing. The bottom band is about execution: governance, risks, and sequencing. The order matters. Teams that start with foundations end up building platforms in search of a purpose. Value first, always.
Box 1: Business outcomes
The anchor box. Name the two to four business outcomes AI should move, expressed in the language your CFO already uses: revenue per customer, cost per claim, cycle time to quote, churn rate. Not “improve efficiency.” Not “leverage AI capabilities.” If an outcome cannot be measured on a system you already run, it does not belong in this box.
A useful test: could a board member read this box and know what success looks like without asking a follow-up? If not, sharpen it.
Box 2: Priority use cases
The three to five use cases you are actually committing to, drawn from your scored portfolio. Each entry needs a one-line value hypothesis: “AI-assisted claims triage cuts average handling time 30%, worth $X annually.” The discipline here is subtraction. Your longlist might have forty candidates. The canvas holds five. Everything else is explicitly deferred, and writing that down is half the value of the exercise.
Box 3: Success metrics
For each use case, the metric, the baseline, the target, and the date you will check. The 2026 shift matters here: productivity metrics alone no longer carry the argument. Tie at least one metric per use case to a P&L line or a named risk. Deployments that report negative ROI at the 12-month mark are traced, in the plurality of cases, to unclear success criteria set at the start. This box is where you prevent that, before a dollar is spent.
Box 4: Data position
The honest assessment. For each priority use case: where does the required data live, who owns it, is it accurate enough, and are you permitted to use it for this purpose? Most organisations discover their real constraint in this box. That discovery is a feature, not a bug: better to find it on the canvas than six months into a build. Data readiness gets its own full article in this track, because it is the single strongest predictor of whether your projects reach production.
Box 5: Capabilities and people
What skills the strategy requires, what you have, and how you will close the gap: hiring, training, partnering. Include the unglamorous roles. Every successful AI programme I have watched had someone doing evaluation, someone doing data plumbing, and someone doing change management. The demos get the applause; these roles get the results.
Box 6: Sourcing posture
Your default stance on build versus buy versus fine-tune, and your model portfolio position: proprietary APIs, open-weight models, or a deliberate mix. You do not need to resolve every case here; you need a default posture and the exceptions. With 85% of organisations now rating open source as important to their AI strategy, “we just use whatever the vendor bundles” is no longer a considered position. Later articles unpack both decisions properly.
Box 7: Governance guardrails
The rules of the road: your risk tiers, what requires review before deployment, who signs off, and which regulations bind you. Keep it to the load-bearing rules. The full governance machinery lives in your governance framework (and my companion track on it); the canvas holds only the guardrails every initiative must respect.
Box 8: Key risks and dependencies
The three to five things most likely to sink the strategy: a data migration that must land first, a regulatory decision pending, vendor concentration, a critical hire. Naming dependencies is what turns optimism into planning.
Box 9: Sequencing and ownership
The order of attack and, crucially, a named owner per use case with real budget authority. Not a committee, a person. Analysis of failed agent deployments keeps returning to the same root causes, and ownership gaps rank near the top. An initiative without an owner is a hope.
Running the canvas session
The canvas earns its keep in the room, so let me share how I recommend running the session.
Who attends. The executive sponsor, the P&L owners whose outcomes appear in Box 1, your data lead, your technology lead, and whoever owns risk. Eight people maximum. This is a choosing session, not a town hall.
How long. A half day, structured in three passes matching the three bands. First pass: value (Boxes 1 to 3), which usually consumes half the session and should. Second pass: foundations (Boxes 4 to 6). Third pass: execution (Boxes 7 to 9).
The rules. Every box gets filled, even if the entry is “we do not know, and finding out is action item one.” Disagreements get written down, not smoothed over. And nothing enters Box 2 without a metric in Box 3 and a data answer in Box 4. That linkage rule is the canvas working as designed: it makes wishful thinking structurally impossible.
Figure 2 shows the session flow and the linkage rules between boxes.
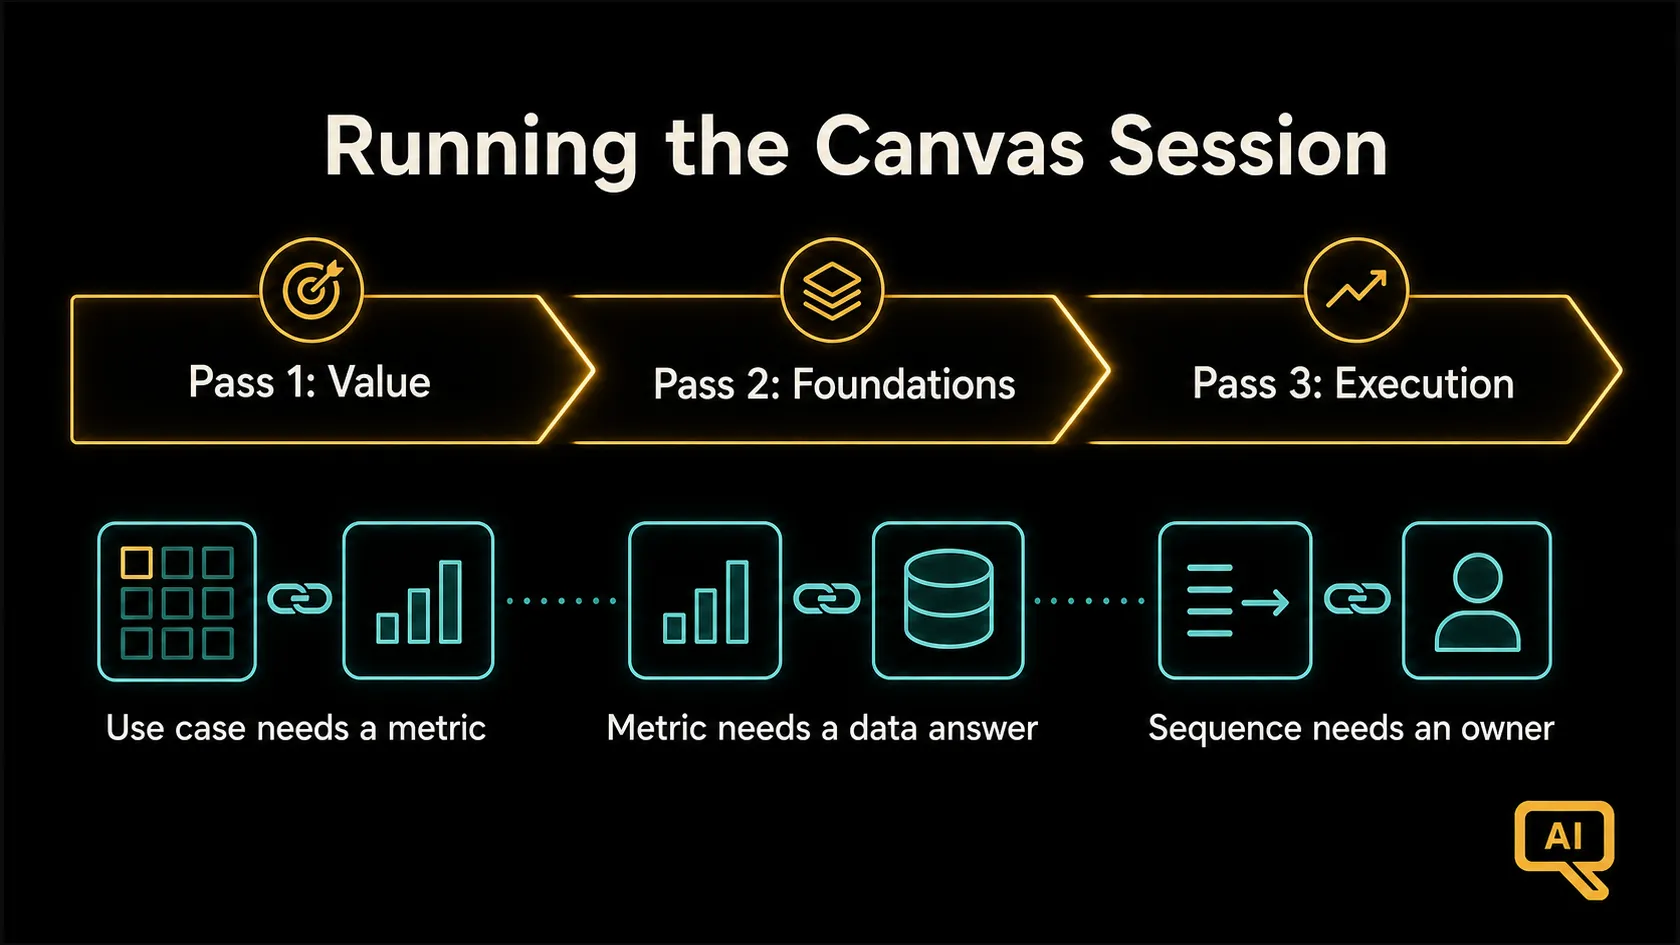
The linkage rules in Figure 2 are what separate a canvas from a poster. A use case with no metric is a slogan. A metric with no data position is a fantasy. A sequenced plan with no owner is a wish. The canvas forces each element to hold hands with its neighbours, and strategies that survive that discipline tend to survive contact with reality too.
Keeping it alive
A canvas filled once is a snapshot. The value compounds when you revisit it quarterly, and the quarterly review is deliberately lightweight: one hour, three questions. What changed in the outside world that touches a box? Which metrics moved, and what does that tell us? What do we now know that we did not know last quarter?
Expect the canvas to change. In this field, a strategy that looks identical four quarters running is not stable, it is neglected. The Digital Omnibus reshuffled EU compliance timelines this year; agent adoption statistics are being rewritten quarterly; model economics shift with every release. Your canvas should absorb these shocks in minutes, which is precisely why it is one page.
A worked fragment
To make this concrete, here is a fragment of a filled canvas for a mid-sized insurer, anonymised and simplified.
Box 1: reduce claims cost per case 15%; lift renewal rate 2 points. Box 2: claims triage assistant; renewal-risk early warning; underwriter document summarisation. Box 3: triage handling time, baseline 41 minutes, target 29, review in Q2. Box 4: claims data centralised and usable; renewal data split across two CRMs, owner named, consolidation is dependency one. Box 6: buy for summarisation, fine-tune open-weight for triage, defer building anything custom. Box 9: triage first (owner: head of claims), renewal second, summarisation opportunistic.
Notice what a page of choices sounds like: specific, checkable, and slightly uncomfortable. That discomfort is the feeling of a real strategy.
What comes next
The canvas will immediately expose your weakest box. For most organisations it is Box 4, the data position, and sometimes it is a gap between ambition and maturity that nobody has said out loud. The next article gives you the tool for that conversation: the AI Maturity Model, an honest way to locate where you really are before you plan where you are going.
Fill in the canvas before you read it. The gaps you find are the agenda.