Here’s a small horror story I’ve heard a few versions of. A team launches their LLM-powered feature. It works great in testing, users are happy, the metrics look fine. Weeks pass. Then, quietly, over the course of a month, response quality drifts down. Costs creep up. Latency slowly worsens. Nobody notices, because nobody was really watching, until one Monday morning a support ticket surfaces something that’s been broken for two weeks. And then the fun of untangling what changed, when, and why begins.
This article is about how not to be that team. LLM systems can degrade silently, in ways traditional software rarely does, and the discipline of watching them is called monitoring. It’s not glamorous, but done well it turns “we found out about the problem when a user complained” into “we saw it in the dashboard three days ago and already fixed it.”
Why LLMs need monitoring more than most software
Traditional software mostly fails loudly. A bug throws an exception. A server dies and pages someone. A database connection drops and you know instantly. LLM systems can fail quietly, and that’s what makes monitoring them essential. A few of the silent failure modes worth naming:
- Quality can drop with no code change. The provider updates the model. Your prompt template changes subtly. Users start asking new kinds of questions your setup doesn’t handle well. The system stays “up” but the answers get worse.
- Costs can climb invisibly. A slow drift in prompt length, an increase in retrieved chunks, a shift in how users interact, and suddenly your per-query cost is 40% higher than it was, with no single event to point at.
- Latency can creep upward as your dataset grows, as your prompts grow, or as an upstream service slows down.
- Behaviour can drift in subtle ways that only show up if you’re comparing today’s outputs to last month’s on the same kinds of inputs.
None of this triggers a red-flashing alert. All of it damages your product. Monitoring is how you see it before your users do.
The four signals worth watching
Cut through everything you’ll read about LLM monitoring and you’re left with four core signals. Figure 1 lays them out.
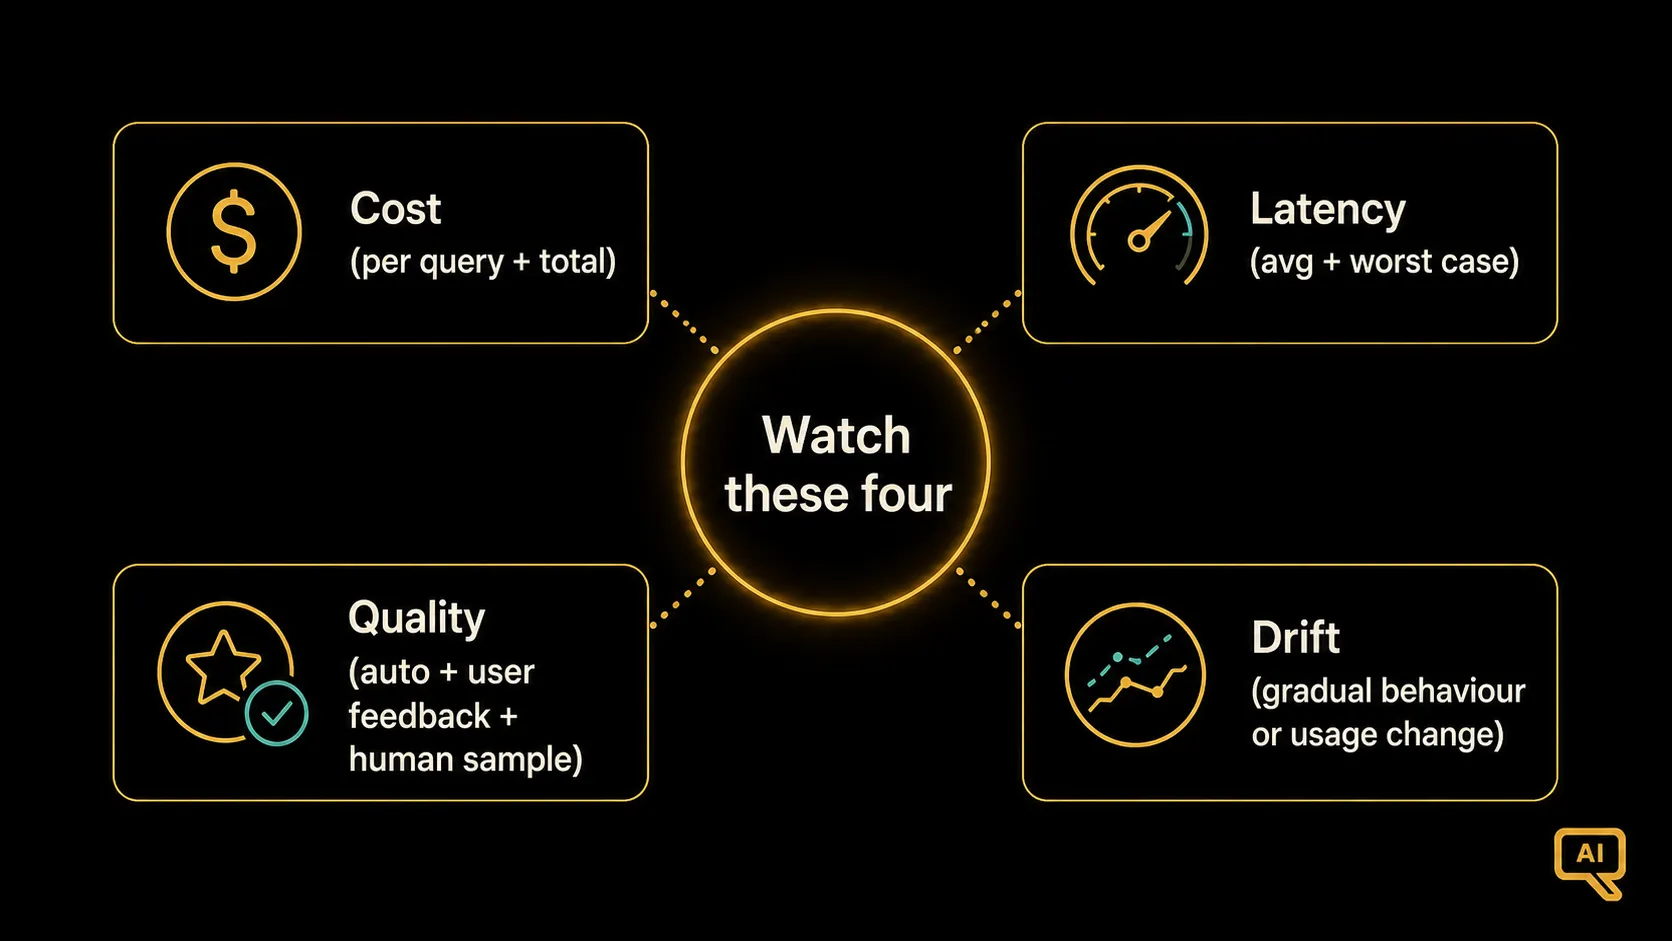 Figure 1: Cost, latency, quality, and drift. Every LLM system in production benefits from watching these four. The specifics vary by application; the shape is universal.
Let me walk through each.
Cost. Not just “how much did we spend this month,” but how much does each query cost on average, and what does the worst 5% look like? Per-query cost is the number that actually catches problems, because a single expensive user or a slowly-growing prompt template shows up as a rising average or a growing worst-case, even when the total spend still looks fine. Break it down by feature or endpoint where possible, so you can see which uses are hurting most.
Latency. Same story: the average tells you how it usually feels, and the worst percentiles (the slowest 5% or 1% of queries) tell you the horror stories your users occasionally hit. Watch both. A system with a great average and a truly awful tail is a system that will make some users hate it while the metrics look fine.
Quality. The hardest one, and the most important. “Quality” for a language model isn’t a single number; it’s usually a bundle of things (correctness, faithfulness, tone, format, completeness). We’ll come back to how to measure it in the next article on evaluation pipelines, but at minimum, most LLM systems should be watching:
- Some form of automatic quality signal (whether outputs pass a small set of automated checks like format or citation presence).
- User feedback signals (thumbs up/down, explicit ratings, whatever your product exposes).
- A periodic human sample review of real production outputs. Even 20 outputs a week, read by a human, catches problems that no automated metric will.
Drift. The distinctive one, and the one traditional monitoring often misses. Drift is any pattern of gradual change in the system: are users asking different kinds of questions than they used to? Is the model’s average response getting longer or shorter? Is the retrieval step returning fewer results per query than it did a month ago? Are certain features being used more or less? These are early warnings for problems that haven’t fully broken yet, but will.
Together, those four give you a workable picture. If you’re only starting with monitoring, start with these.
What a workable dashboard actually looks like
You don’t need a fancy tool for any of this on day one. A simple daily digest, or a lightweight dashboard, that shows the numbers below is far better than nothing. Figure 2 shows a minimal but useful setup.
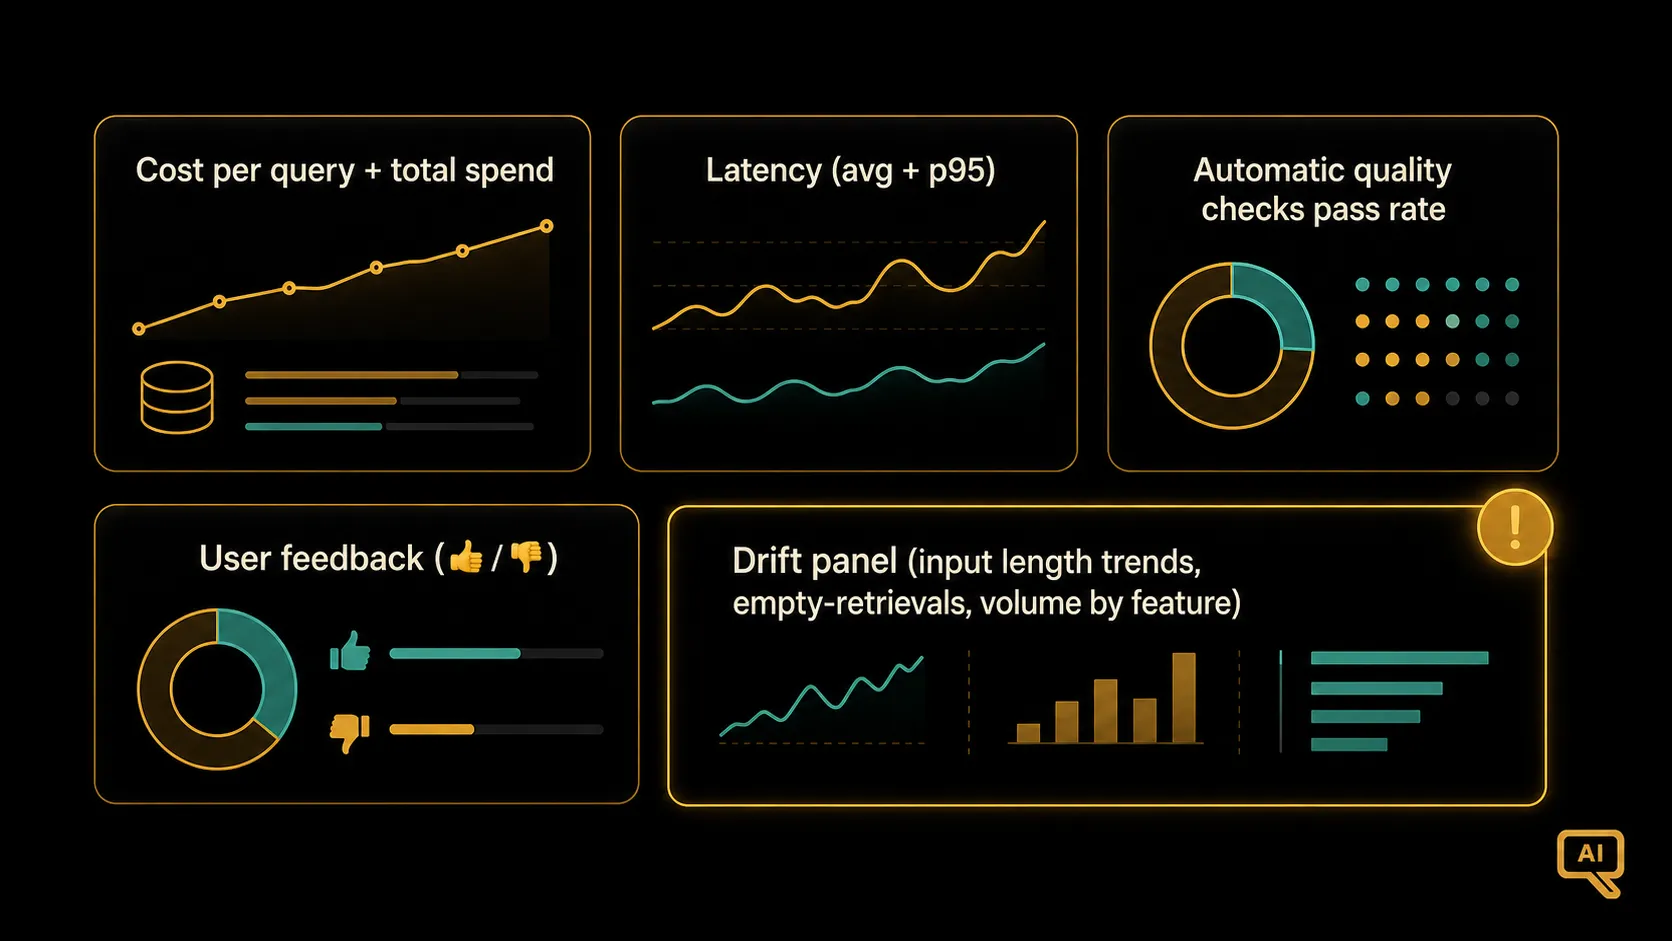 Figure 2: A workable starting dashboard. Cost per query and total spend. Latency average and worst-case. A small set of automatic quality checks. User feedback aggregate. A drift panel showing input length trends, empty-retrieval rates, and volume by feature. Nothing fancy, and enough to catch most problems early.
Reading it in a bit more detail. Each tile is one signal, at one glance. Cost per query going up over time? Investigate what changed. Worst-case latency spiking above your threshold? Same. Quality checks passing at a lower rate than last week? Look at recent changes to prompts, model, or data. Thumbs-down rate climbing? Sample a few and read them. The point isn’t that any single number tells you everything; it’s that having all of them in one place lets you spot correlated patterns quickly.
You can absolutely buy a fancy LLM observability tool for this, and there are good ones (Langfuse, Helicone, Arize, and others). But you can also start with your existing logging stack (whatever you use for regular software), a small daily job that computes these summaries, and a page in your existing dashboarding tool. Get the habit first; upgrade the tooling later.
What to log for every single request
The dashboard rides on top of the raw log data, and this is where a lot of teams under-invest. For every LLM request that hits your system, aim to log at minimum:
- The prompt template version that was used. When something changes, you need to know which template was live.
- Model version and provider. Because these can change under you, and you’ll want to correlate quality dips with upgrades.
- Token counts in and out. This is your cost basis.
- Timing, ideally broken down by stage (retrieval time, model call time, total time).
- Any errors or retries, so you can see when the system had trouble.
- A hashed request ID and metadata (feature, user segment) so you can slice by dimension.
Notice what’s not on that mandatory list: the actual content of prompts and responses. Whether to log those depends on your privacy and compliance situation. Many teams log a sample of contents, or store them separately with tighter access. Do whatever fits your obligations; just don’t lose the metadata, which is what powers everything else.
Alerts that don’t cry wolf
A short pragmatic word on alerting. It’s tempting to alert on everything, and then no one pays attention to alerts anymore. Better to alert on a small number of things that actually matter, at thresholds that reflect real problems. Some sensible starting alerts:
- Cost per query rises above a threshold (say, 25% above baseline) over a rolling window.
- Worst-case latency crosses a threshold you care about (say, p95 above 10 seconds).
- Automatic quality-check pass rate drops below a threshold.
- Error rate spikes above baseline for more than a short window.
Everything else can live on the dashboard for humans to notice during their regular review. Alerts are for genuine urgency; dashboards are for regular awareness. Keep the distinction.
Where monitoring fits with everything else
Look at what we have now. Serving (article 9) gets your system live. Monitoring (this article) tells you what it’s doing once it’s live. But monitoring alone doesn’t tell you whether a change you’re about to make will help or hurt; that’s the job of a proper evaluation pipeline, run against a stable test set on every change, before it goes to production. Those two, monitoring in production and testing before production, are the two pillars that keep quality steady over time. The pre-production one is where we head next.
Next in the series: Evaluation Pipelines & Golden Test Sets, the automated regression testing that keeps LLM apps from silently breaking.